Rising rates will determine this market
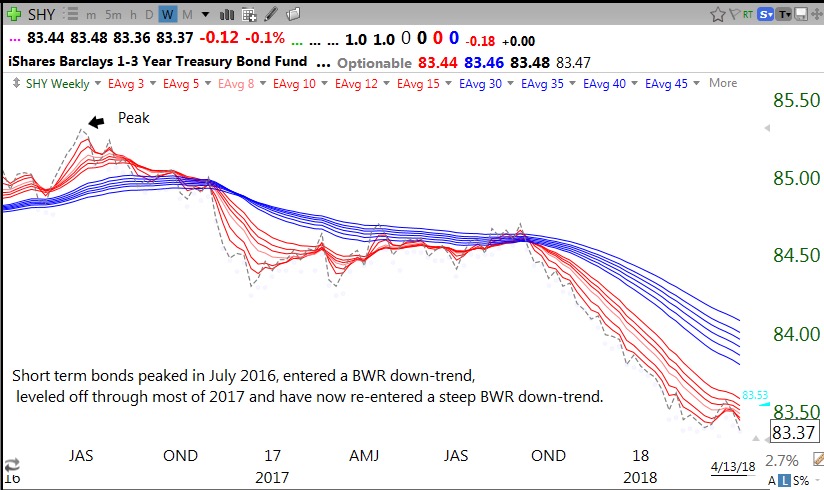
Behind the movement of the market is the move to higher short term interest rates being engineered by the Fed. This chart shows the recent steep weekly BWR decline (see glossary) in short term treasury bonds, indicating rising rates.
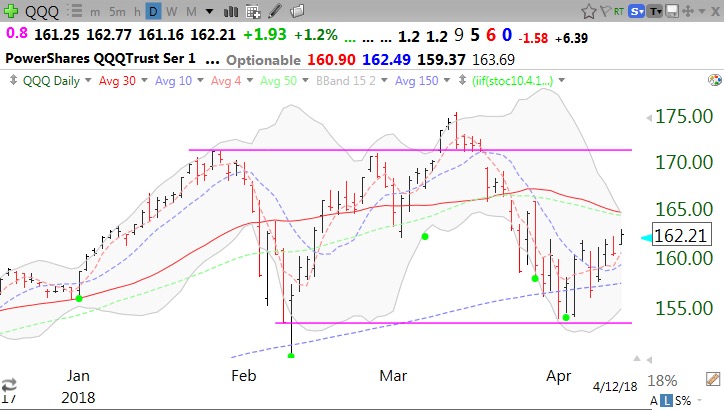
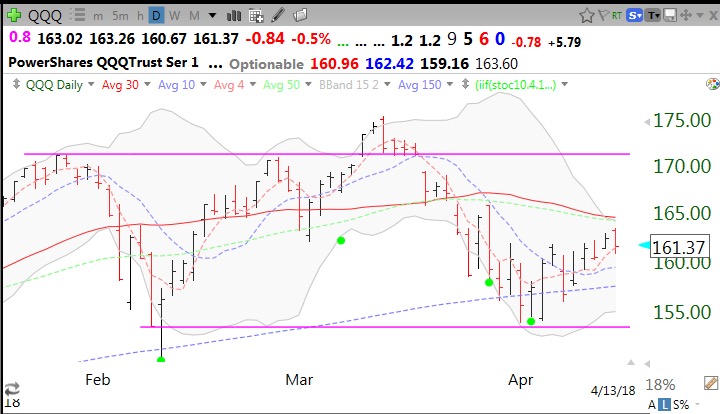
The QQQ remains between short term support and resistance (daily chart).The fact that the 50 (green dotted) and 30 day (red line) averages are declining and the QQQ is just below its upper declining 15.2 daily Bollinger Band suggests to me there may be more short term weakness. I remain in cash until the market reveals its intentions.
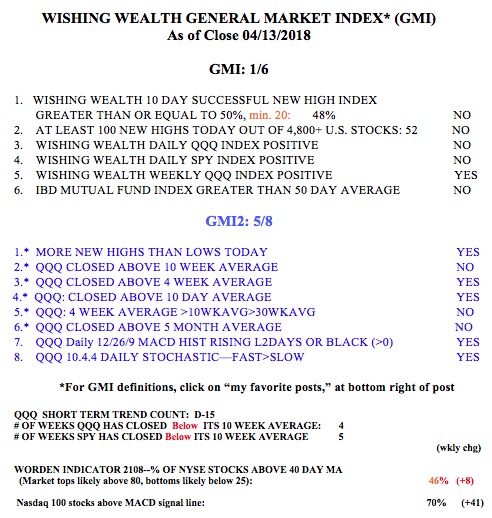
The GMI remains Red.
QQQ near resistance; 14th day of $QQQ short term down-trend
QQQ is approaching resistance at declining 30 and 50 day averages and upper Bollinger Band.