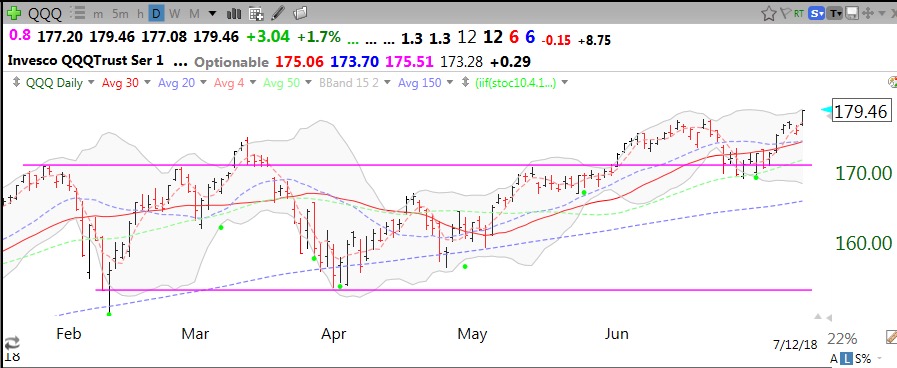
Daily stock charts are good for determining entry set-ups and initial stops, but daily charts often mislead me and scare me out of good positions. Before I sell out of a long position I should remember to look at the longer term trends evident in the weekly RWB charts (see glossary). Once my entry set-up holds and I am not stopped out, I could actually just hold onto any equity in an RWB weekly up-trend pattern until the white band in the middle (the W in RWB) disappears.
This chart of QQQ shows that its RWB weekly up-trend pattern has never disappeared since 2017! The 6 shorter term moving averages (red lines) have remained well above the 6 longer term averages (blue) with a white space between them. The dotted line shows each weekly close. Sometimes the dotted line moves below the red lines but as long as the red white and blue pattern persists with the red lines above the blue, the advance is continuing. In fact, in a strong up-trend the equity repeatedly closes the week above all 12 averages. (The exact RWB averages are specified in my blog glossary.)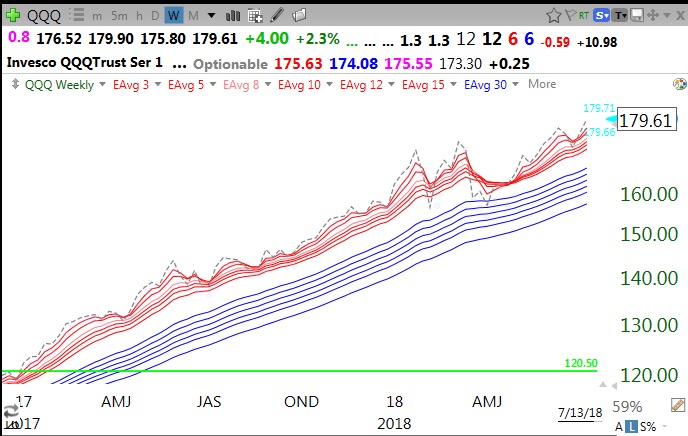
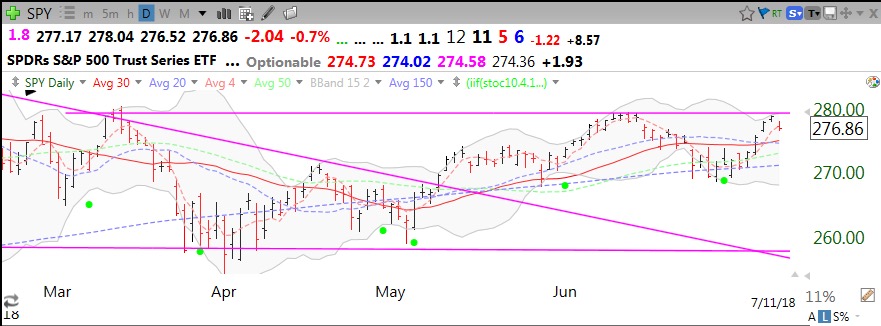
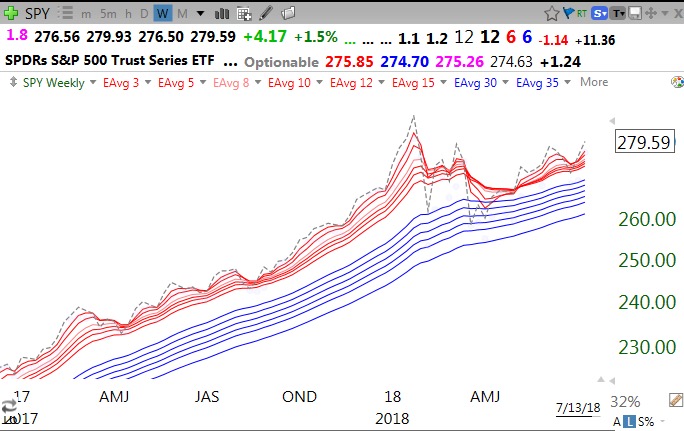
The SPY lost its RWB weekly pattern for a very short period, but it has now resumed.
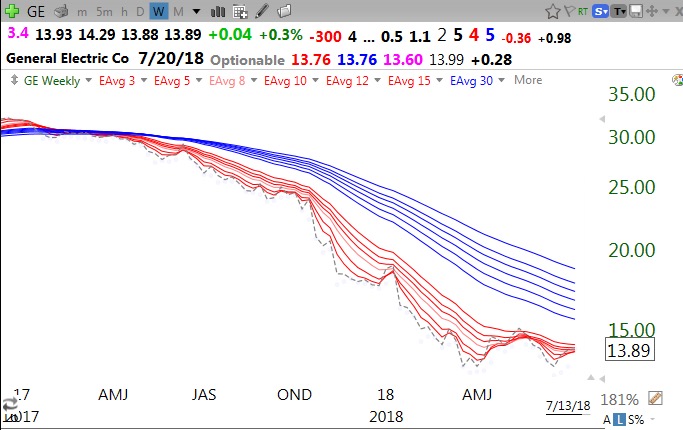
A good rule for me is to never buy and to sell or sell short any equity with the opposite BWR weekly down-trend pattern. GE is a great example of a BWR weekly down-trend. Why would anyone ride this stock down after April, 2017?
CAT remained in an RWB weekly up-trend pattern most of 2017 with the dotted line (weekly closes) leading the other averages higher. Once the dotted line moved below the red lines and the red lines converged with the blue there was no reason for me to own CAT. All stocks I buy or retain must be in an RWB weekly up-trends.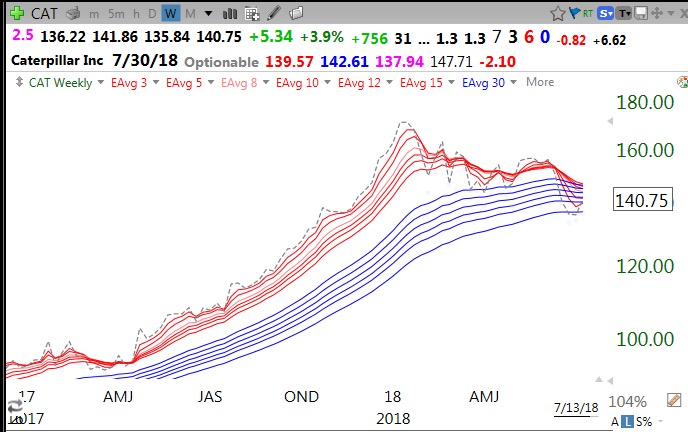
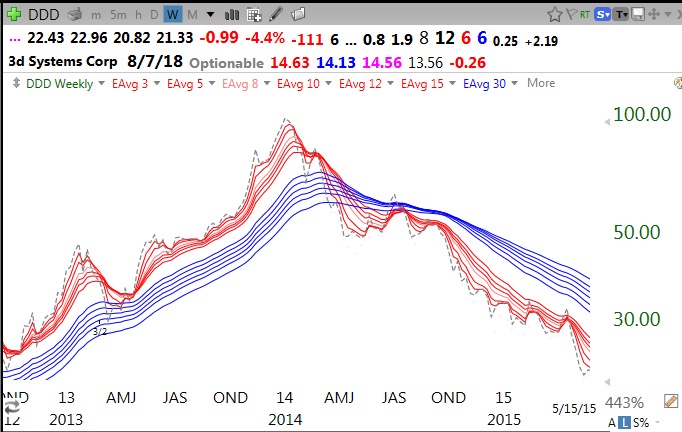
This chart vividly shows a complete advance/decline cycle for DDD from 2013-2015. It all looks so clear and easy in hindsight!
Why did I let myself and urge my son, sorry Mike 🙁 , to get scared out of his great pick, SQ which he bought around $11? I now know why–I focused on the daily chart.
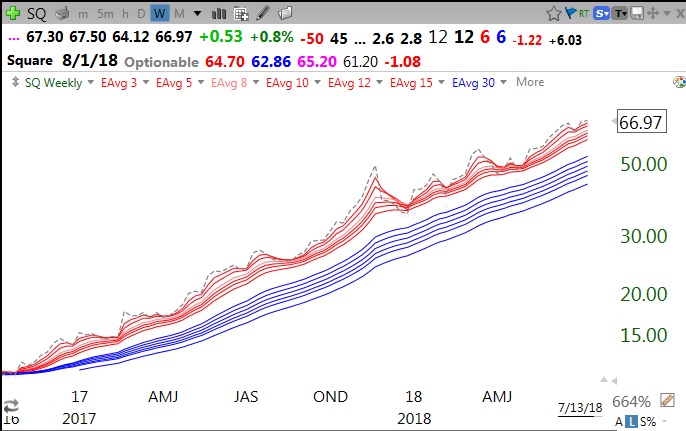
I think the weekly RWB strategy can keep me in a good position and reduce the need to closely monitor and be stressed by the daily back and forth gyrations of any stock or ETF I own….
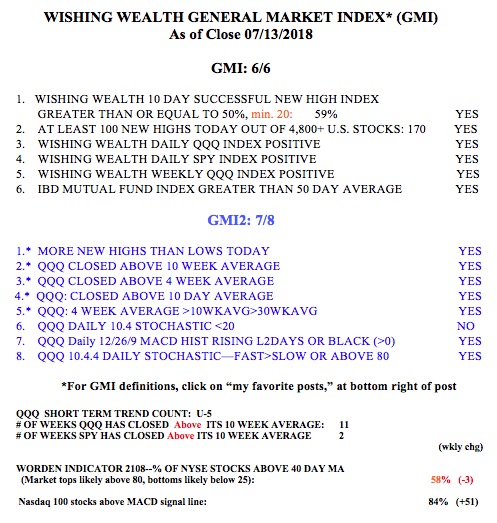
Meanwhile, reflecting the strength in the QQQ and its weekly RWB pattern, the GMI remains on a Green signal, at 6 (of 6).