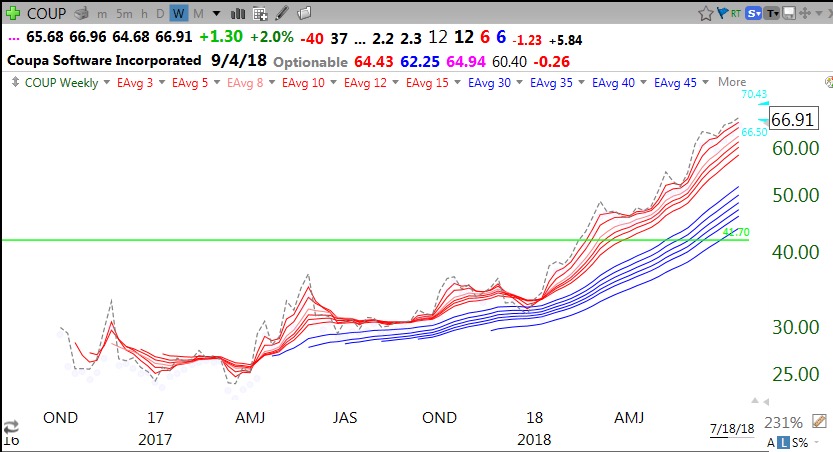
IPO Weekly RWB: $COUP 8th day of $QQQ short term up-trend
COUP is in a weekly RWB up-trend and above its GLB.
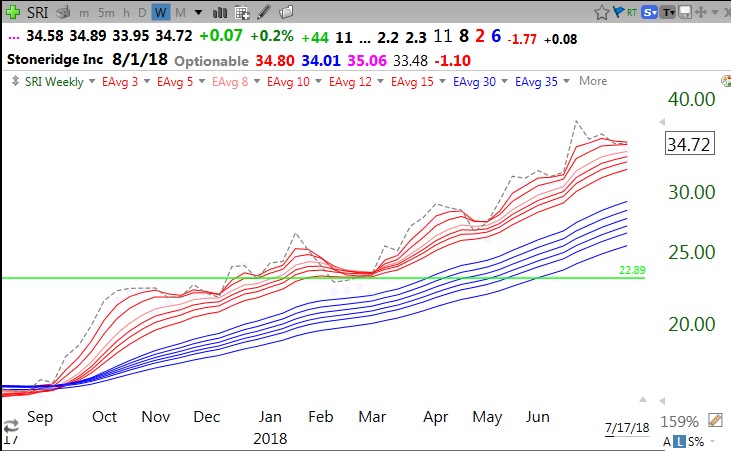
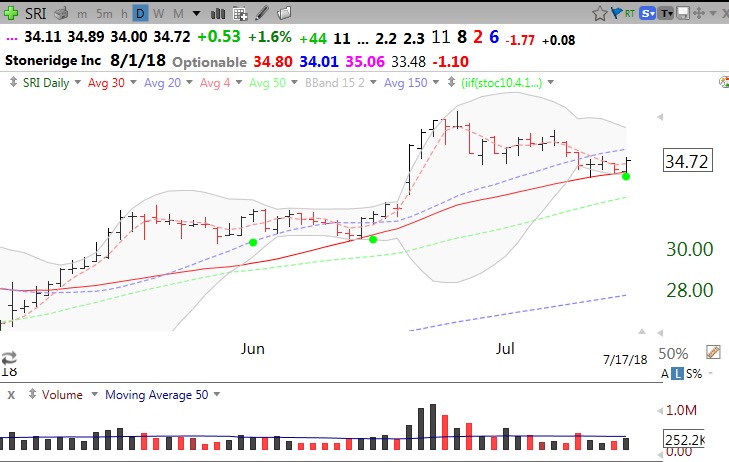
BOS: $SRI
SRI appears to have bounced off of support (BOS). SRI had a green dot signal (see glossary) and bounced up off of its lower Bollinger Band and 30 day average (red line). SRI is also above its last green line top (see weekly chart below). A close below 34 would cause me to exit. Earnings are expected on 8/1. I find buying a bounce safer because if it fails to hold the bottom I can exit quickly with a small loss. It is much easier for me to buy bounces than buying break-outs, as long as the stock is in a nice up-trend.
Here is its RWB weekly chart–a nice RWB up-trend since September, 2017.