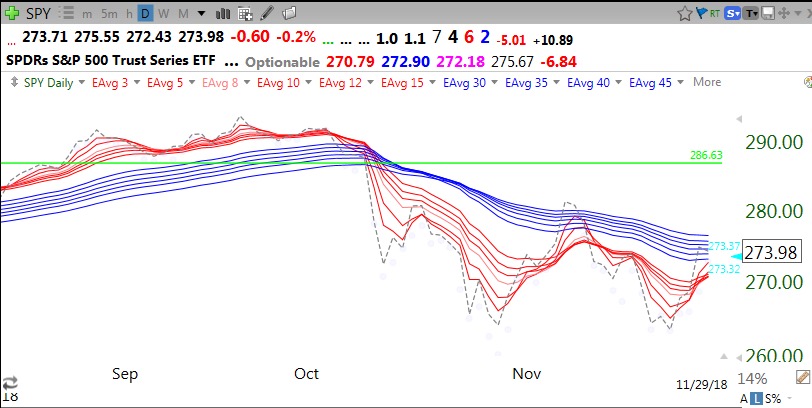
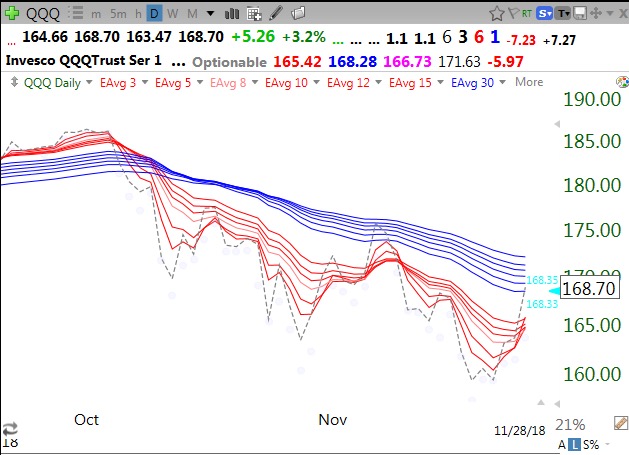
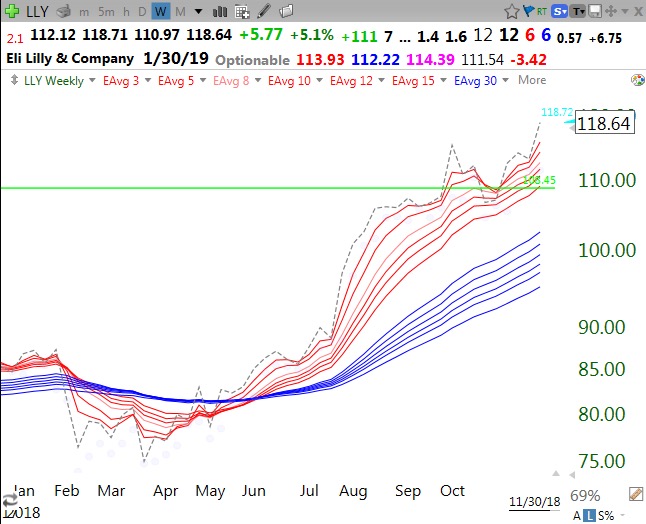
Last Thursday my QQQ short term indicator turned up. So the QQQ short term up-trend count in the GMI table below is now U-2. Given this change and that the IBD says market is in a confirmed up-trend, it is time to look for the strongest stocks hitting all-time highs (ATH). After the 2008 market debacle, I discovered GMCR as it went quickly to an ATH. So here is a list of 11 stocks that hit an ATH last week and had recent quarterly earnings up 19% or more from the prior year: $EMCI $BEAT $CINF $HELE $SHEN $ATNI $AMED $LLY $HCA $CDXS $SUI. The way I trade such stocks is to put them in a watch-list to monitor for one of my buy set-ups. The only exception is if one had a recent green line break-out (GLB). In that case I might buy it right away but sell immediately if it closes back below the green line. This weekly chart shows that LLY recently retested a GLB after breaking through its ATH peak reached in 2000. LLY is already up 60% from its low this year.
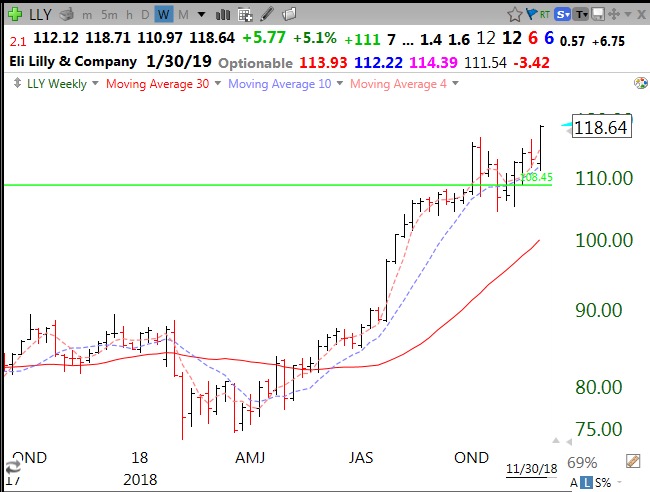
LLY has a nice Guppy chart with a weekly RWB pattern.
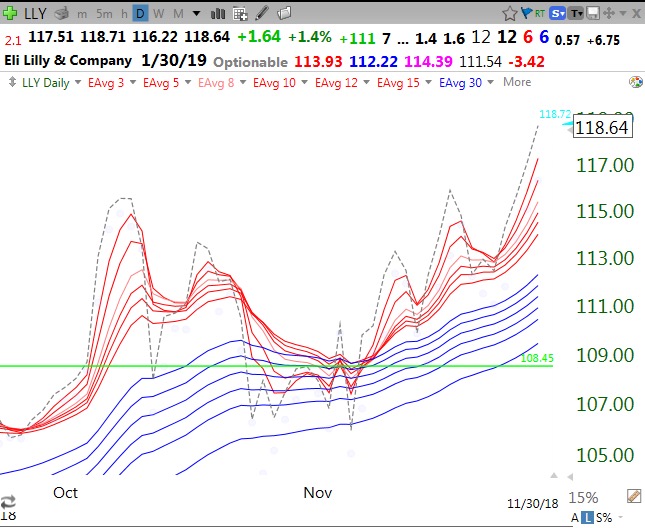
And a daily RWB pattern.
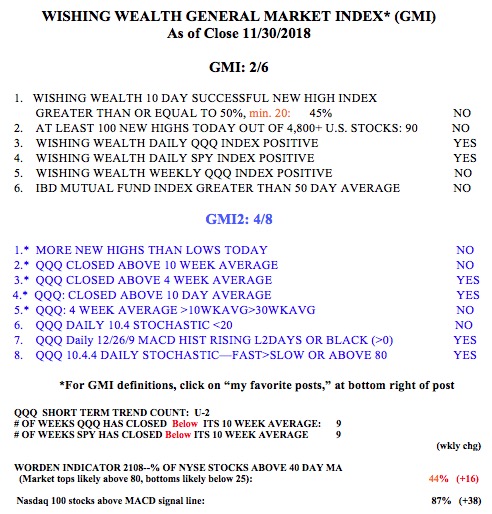
The GMI remains on a Red signal and is at 2 out of 6.