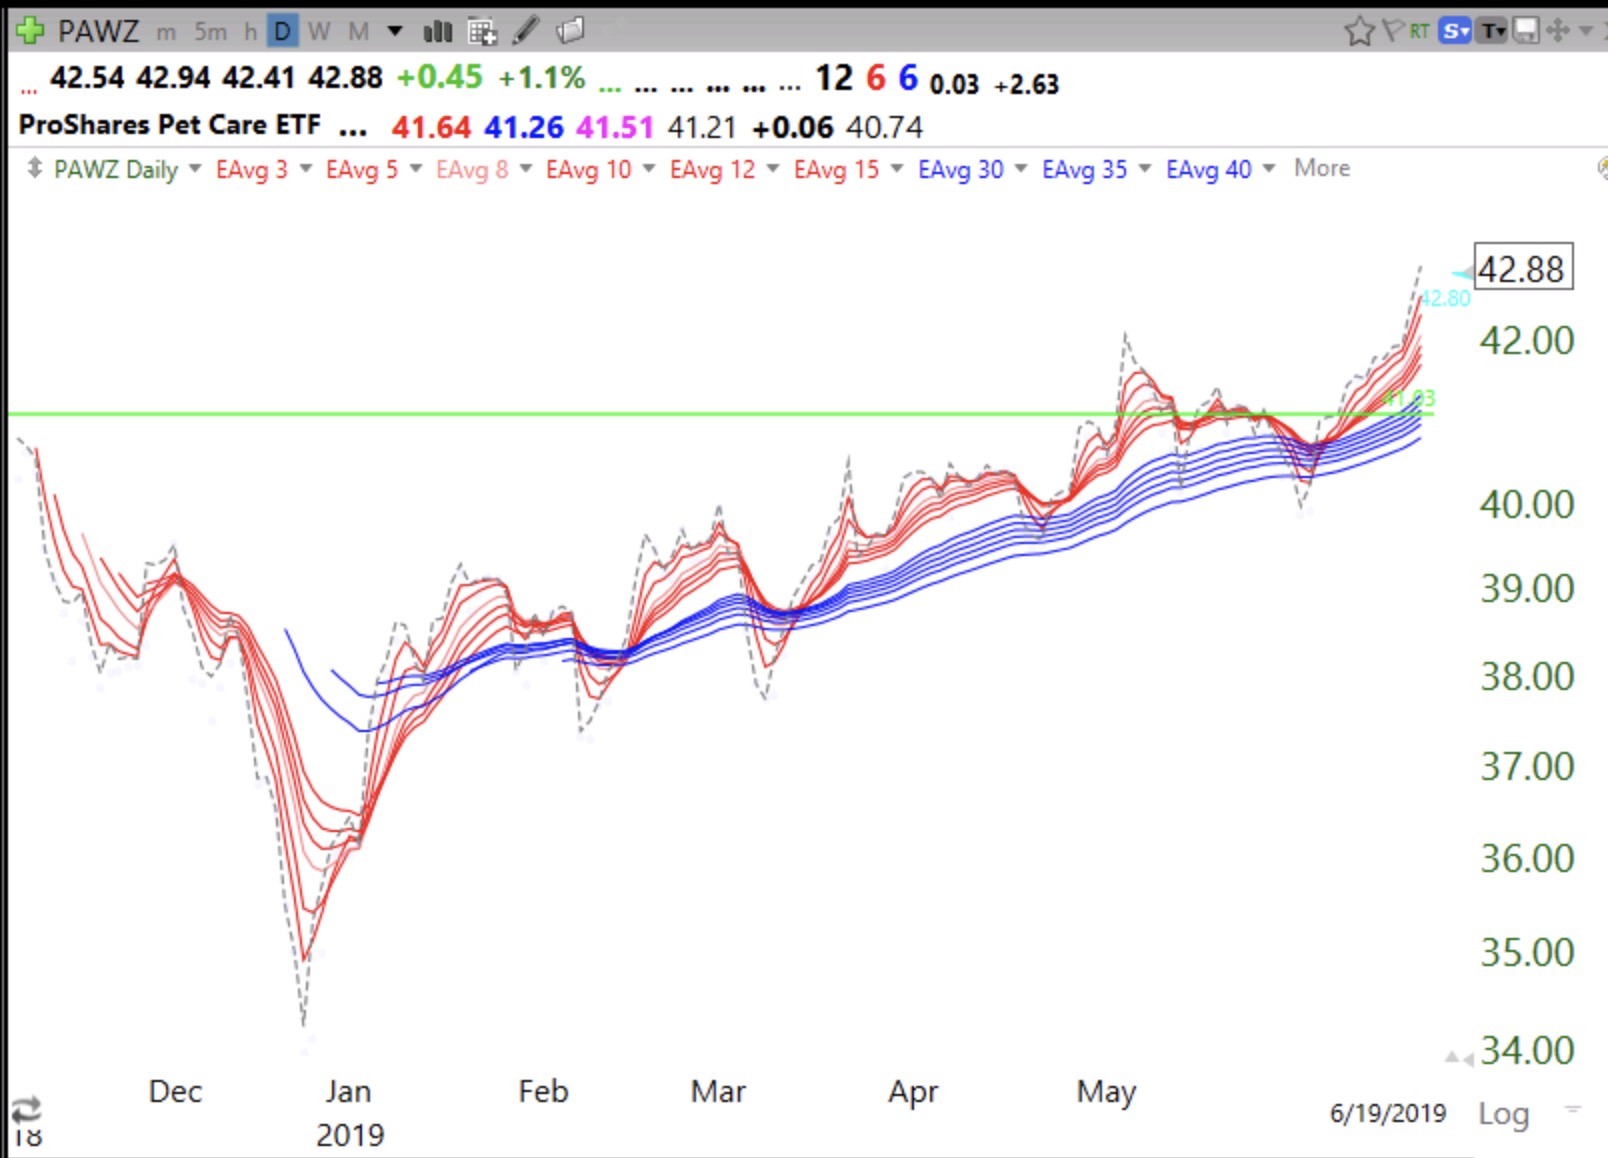
My “Pet” ETF: $PAWZ; 7th day of $QQQ short term up-trend, U-7
I inherited my late sister’s mini labradoodle in December and have fallen in love and become aware of the huge pet industry and owners’ apparent willingness to spend heavily on their best friends. I was therefore intrigued by the new ETF that holds stocks of pet related companies. PAWZ came public last November. I noticed PAWZ when it had a GLB a few weeks ago (green-line break-out, see weekly chart below) to a an all-time high. I own PAWZ. It only trades about 8,000 shares per day, but that is okay with me because it is an an ETF. One day this ETF may be unleashed……
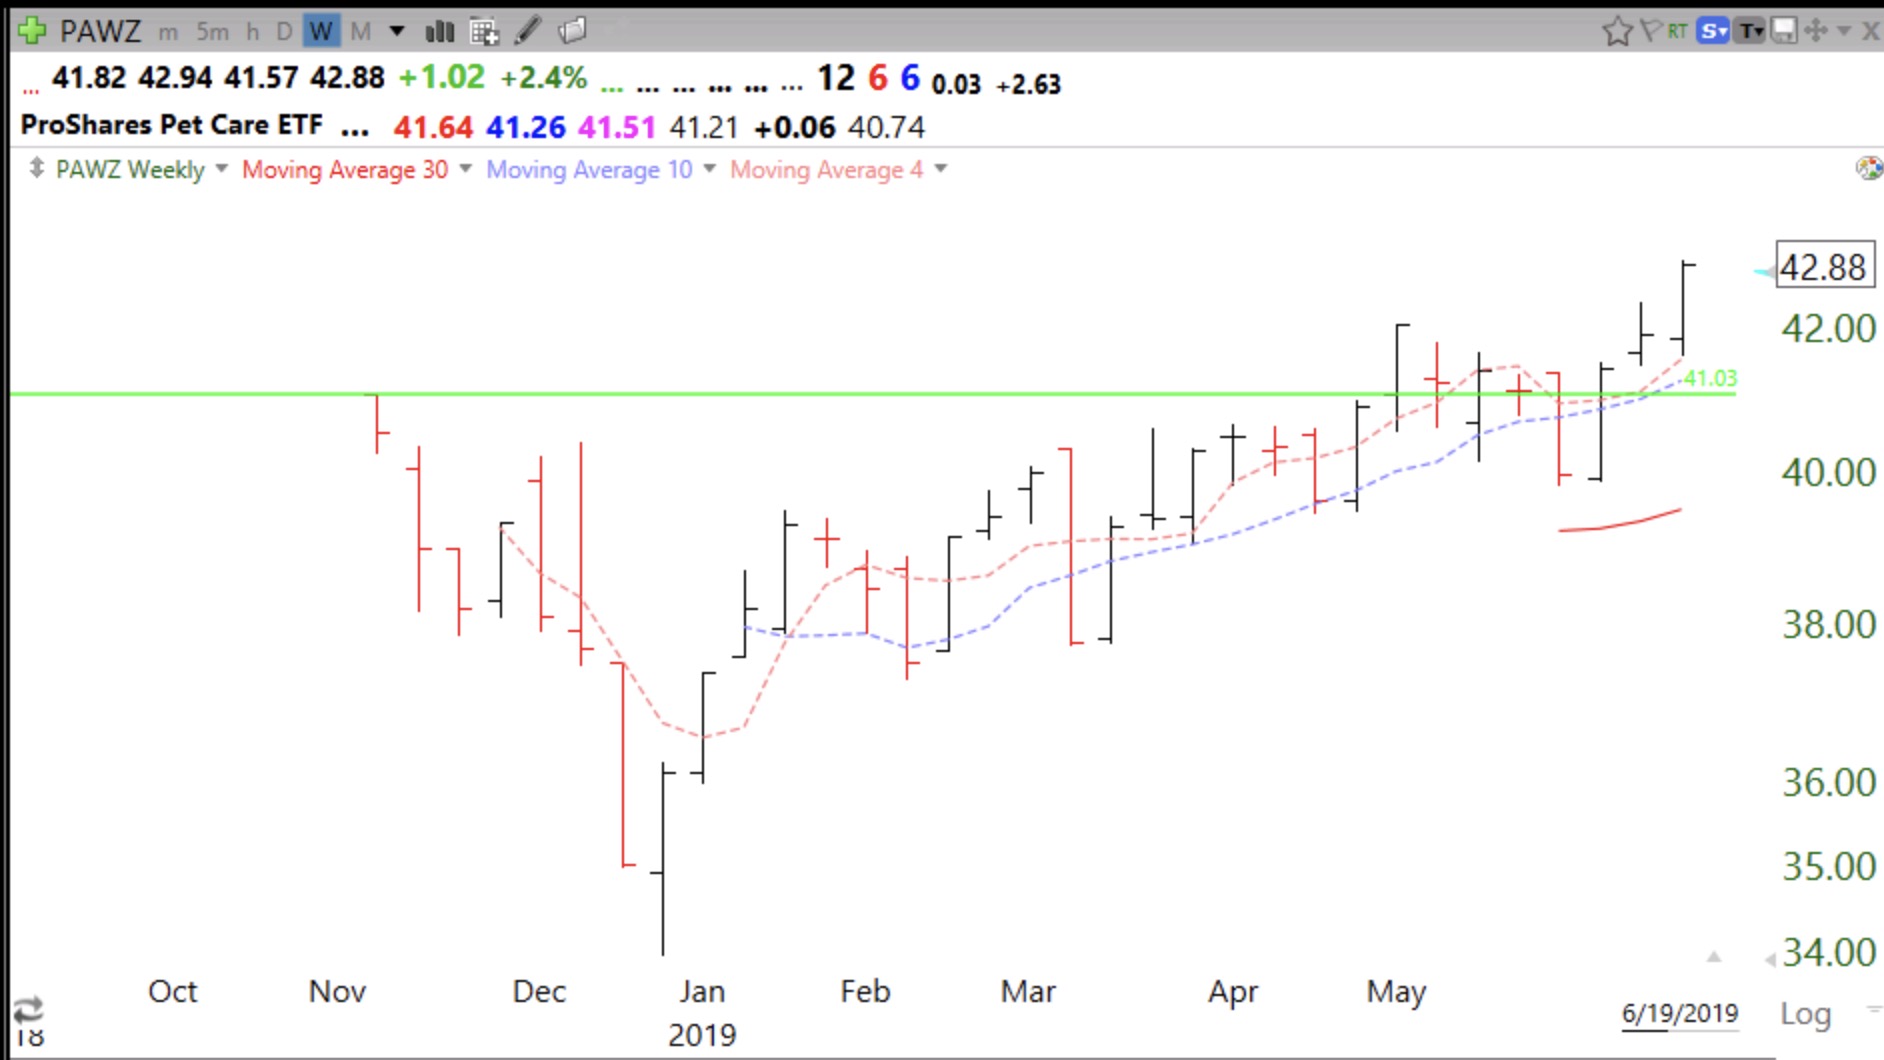
PAWZ is also in a daily RWB up-trend.
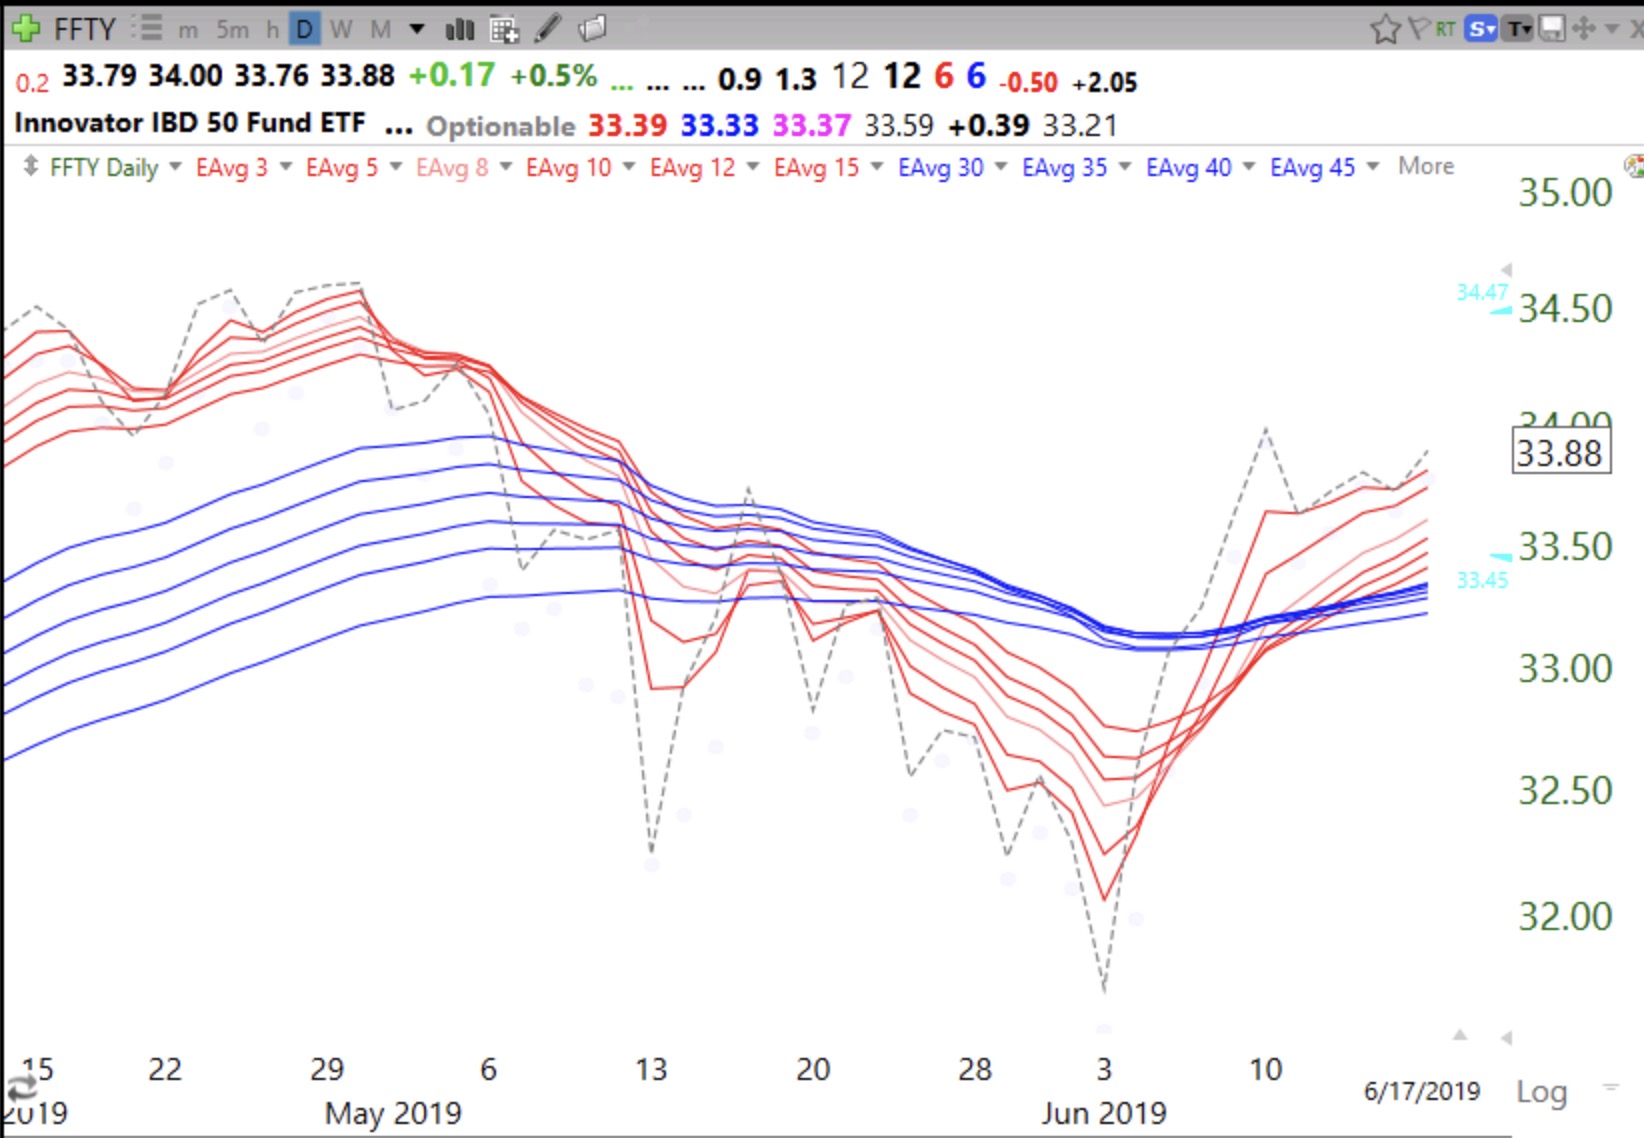
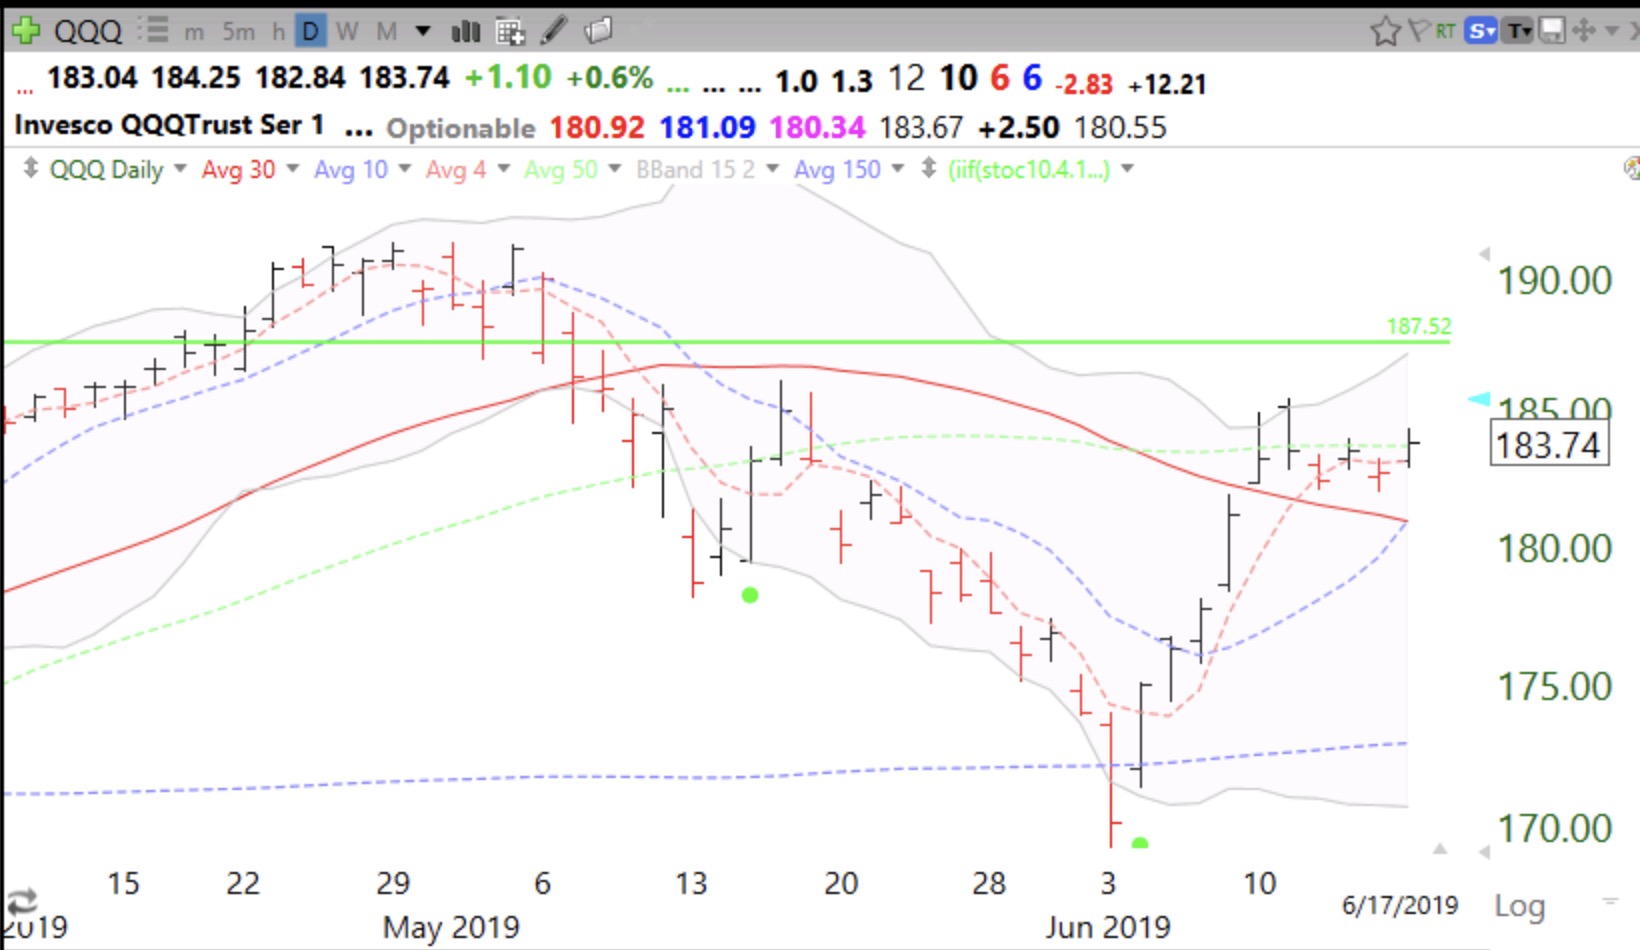
$QQQ retakes 50 day average; 5th day of $QQQ short term up-trend; $FFTY, IBD 50 ETF, begins daily RWB up-trend
IBD 50 fund ETF begins daily RWB up-trend