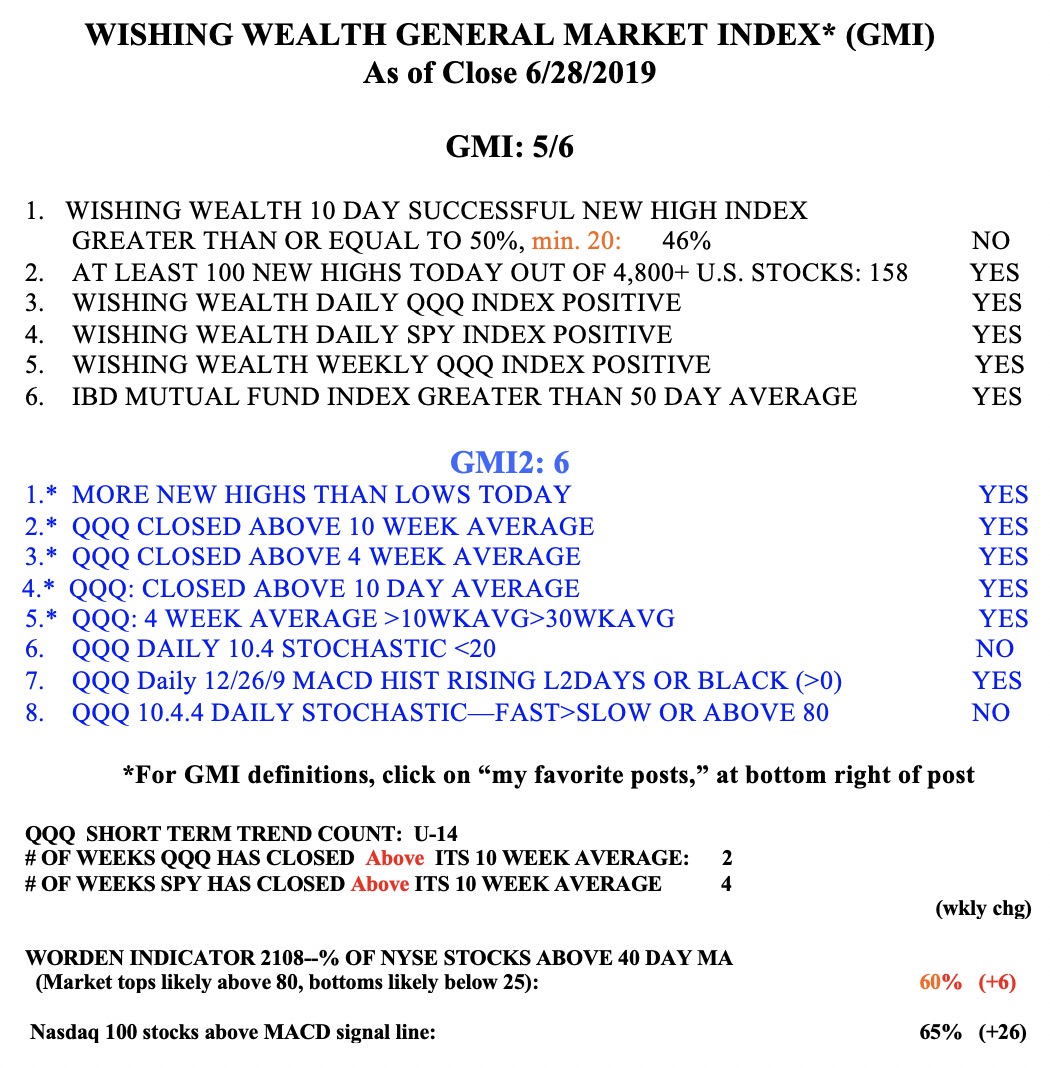
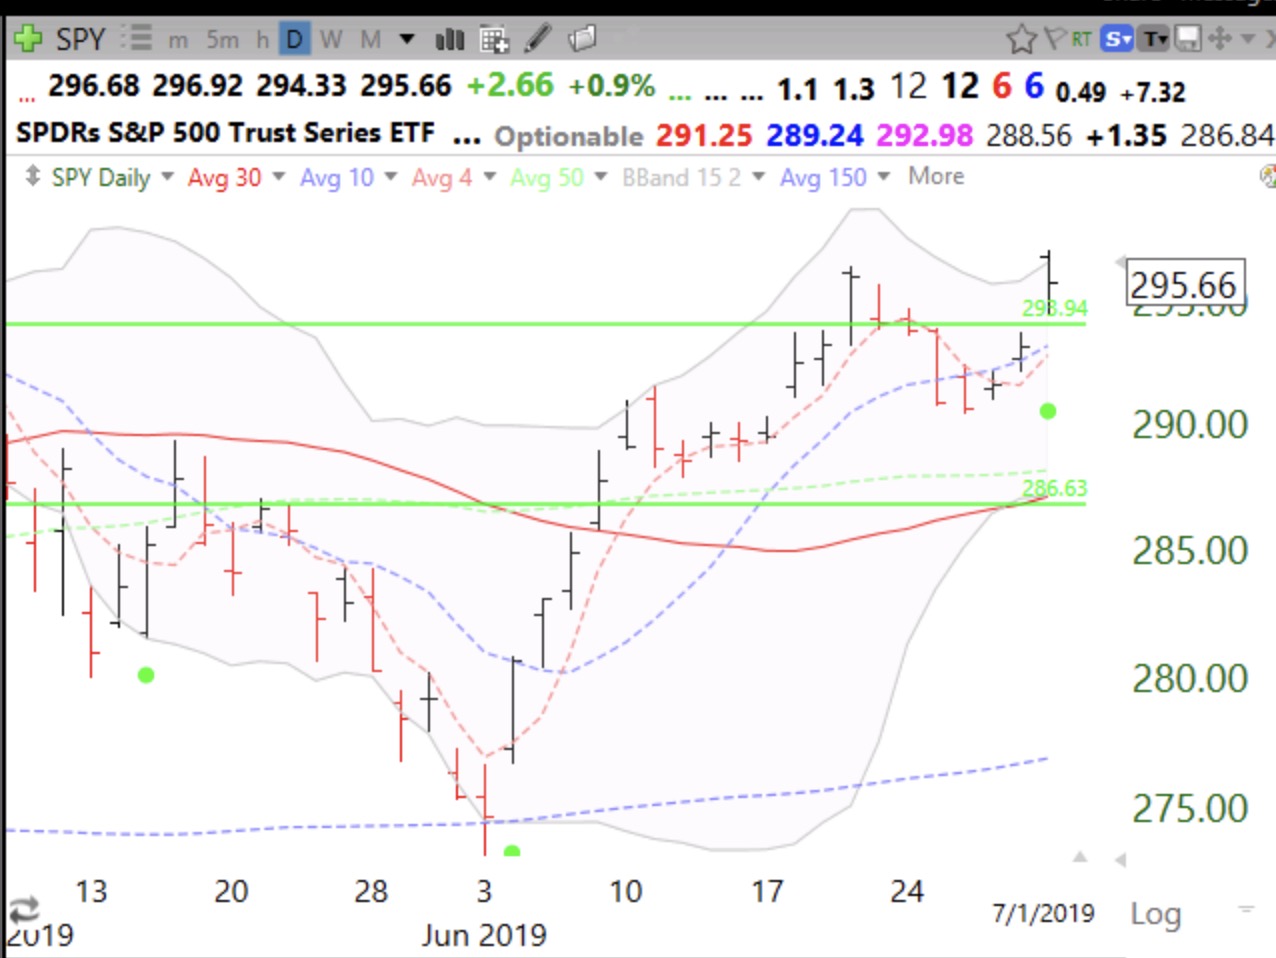
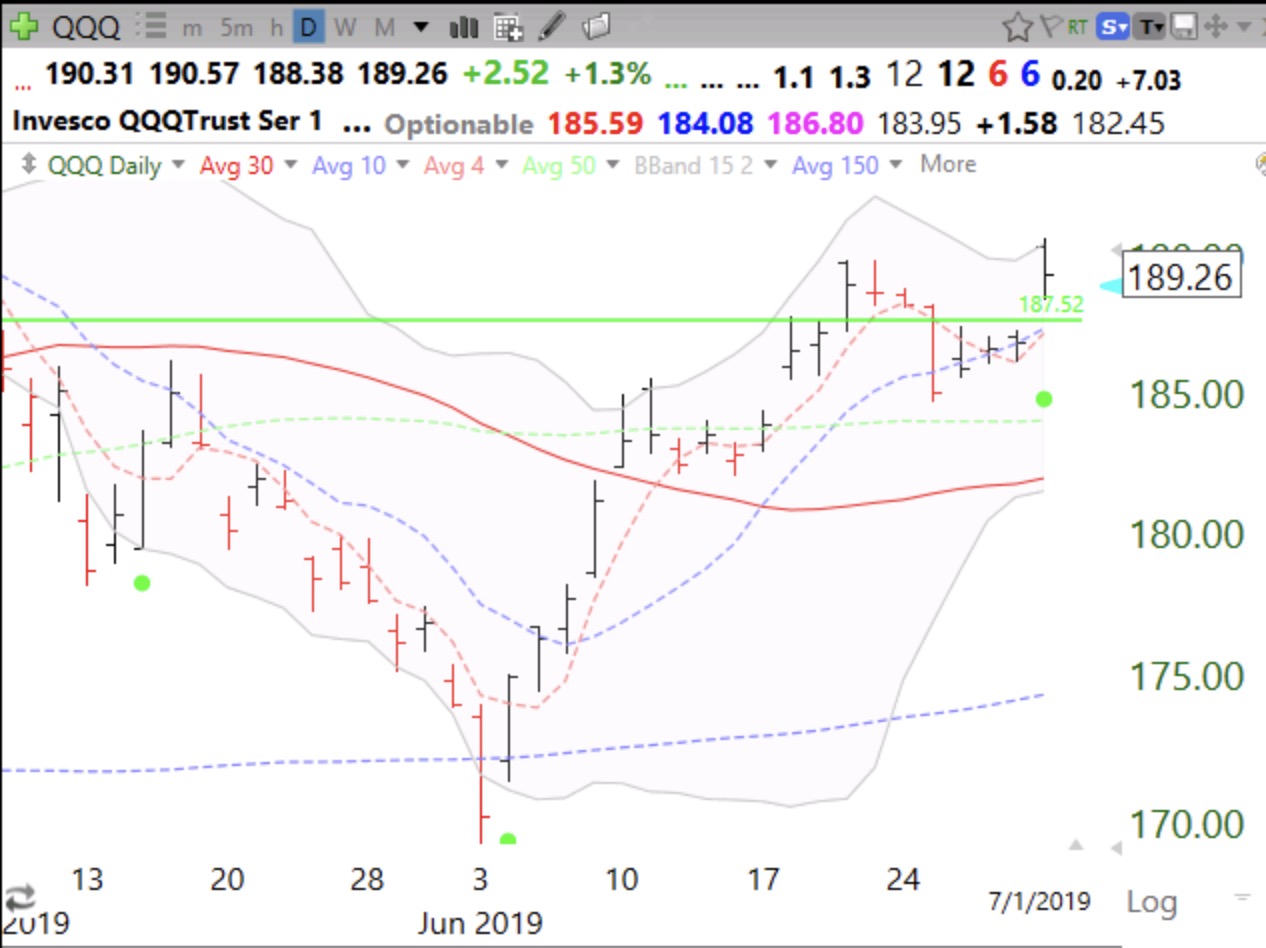
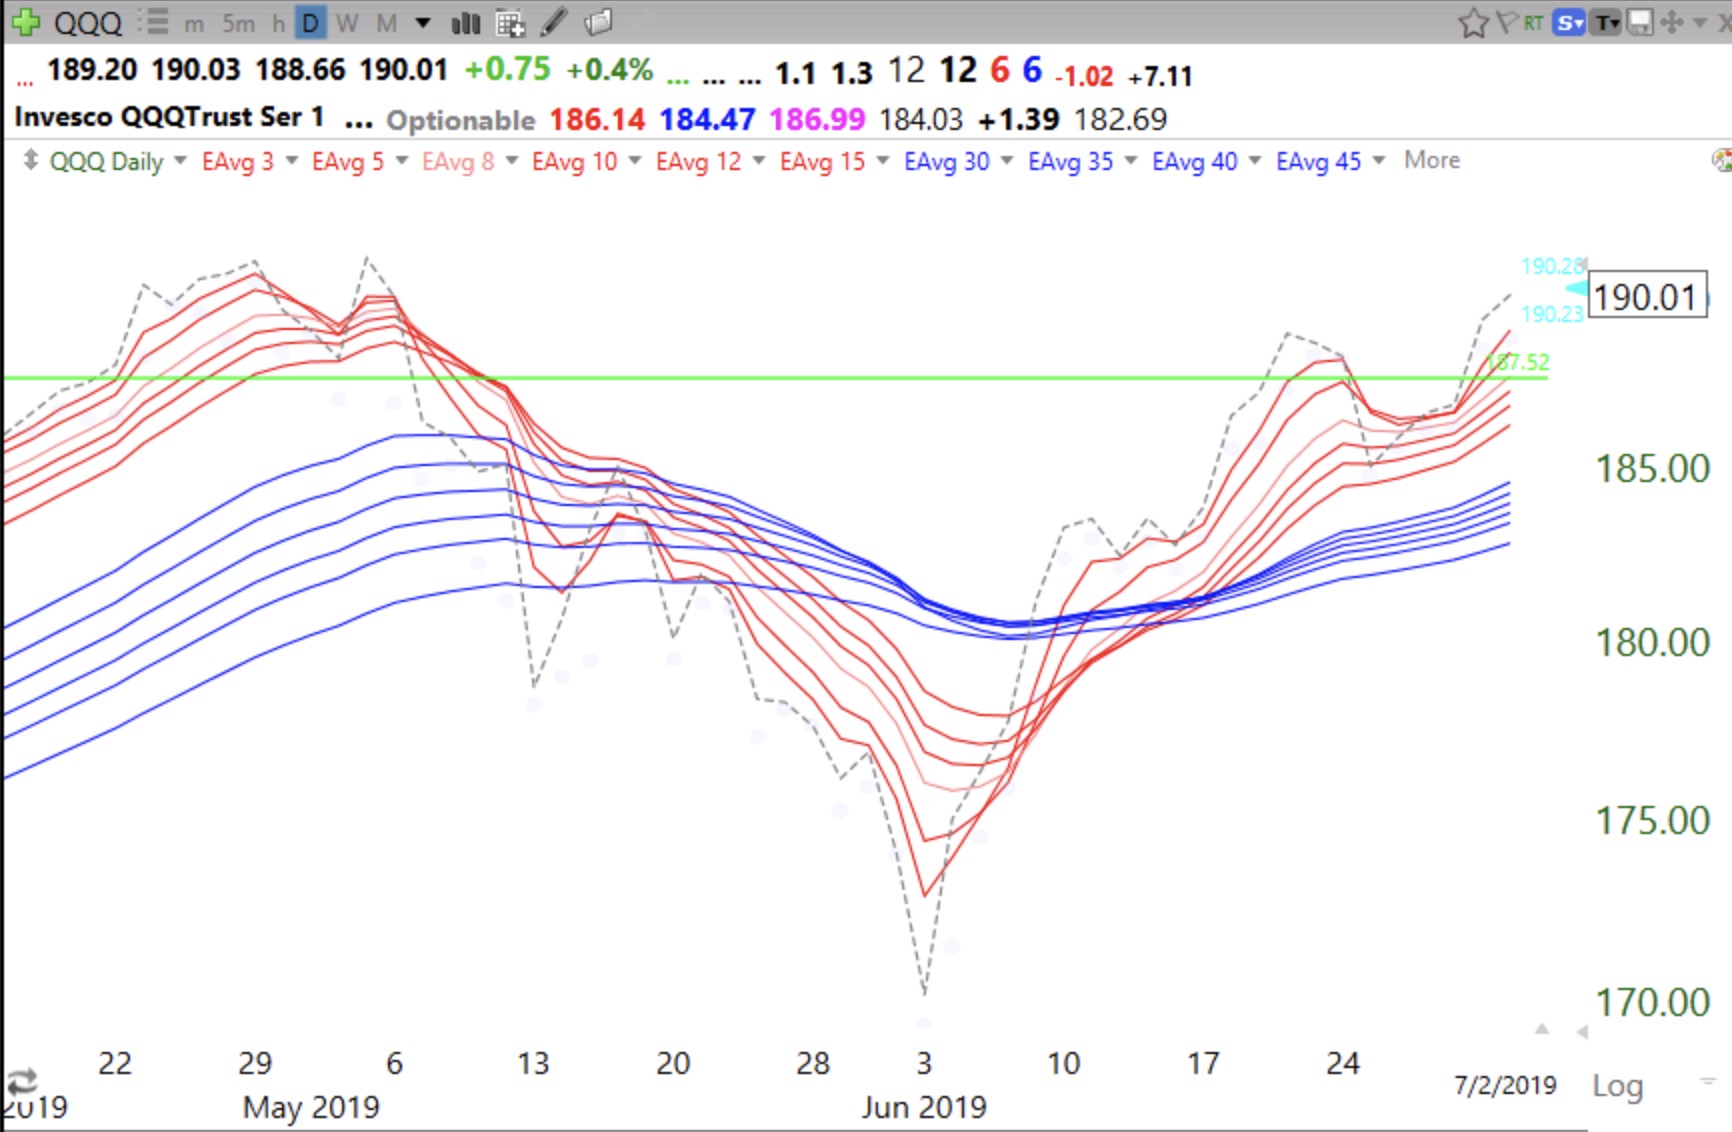
QQQ remains in a daily RWB (red white and blue) up-trend. Happy 4th…….
Stock Market Technical Indicators & Analysis
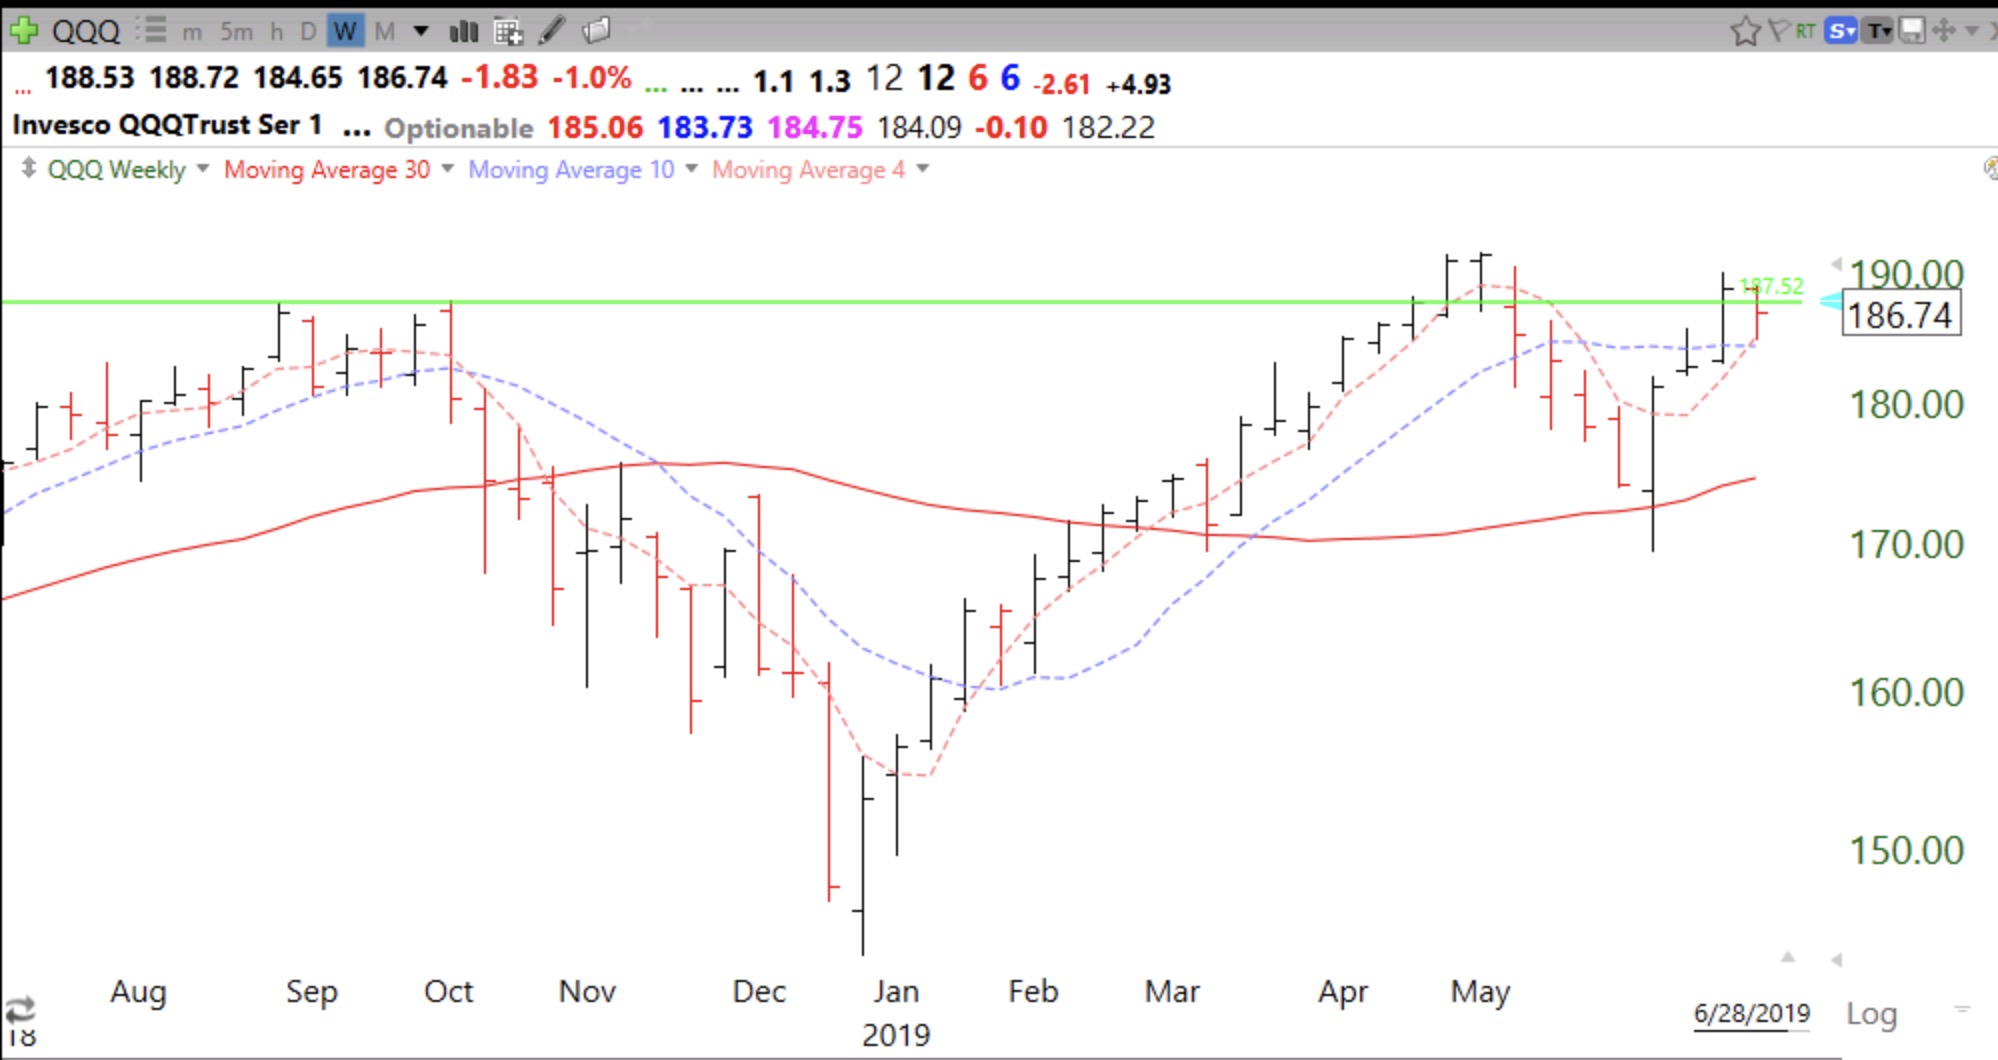
QQQ remains in a daily RWB (red white and blue) up-trend. Happy 4th…….
QQQ found support at 4 week average (red dotted line) and now 4wk>10wk>30wk, a powerful up-trend. Mutual fund end of quarter window dressing worked again. All time market highs are likely on the horizon.