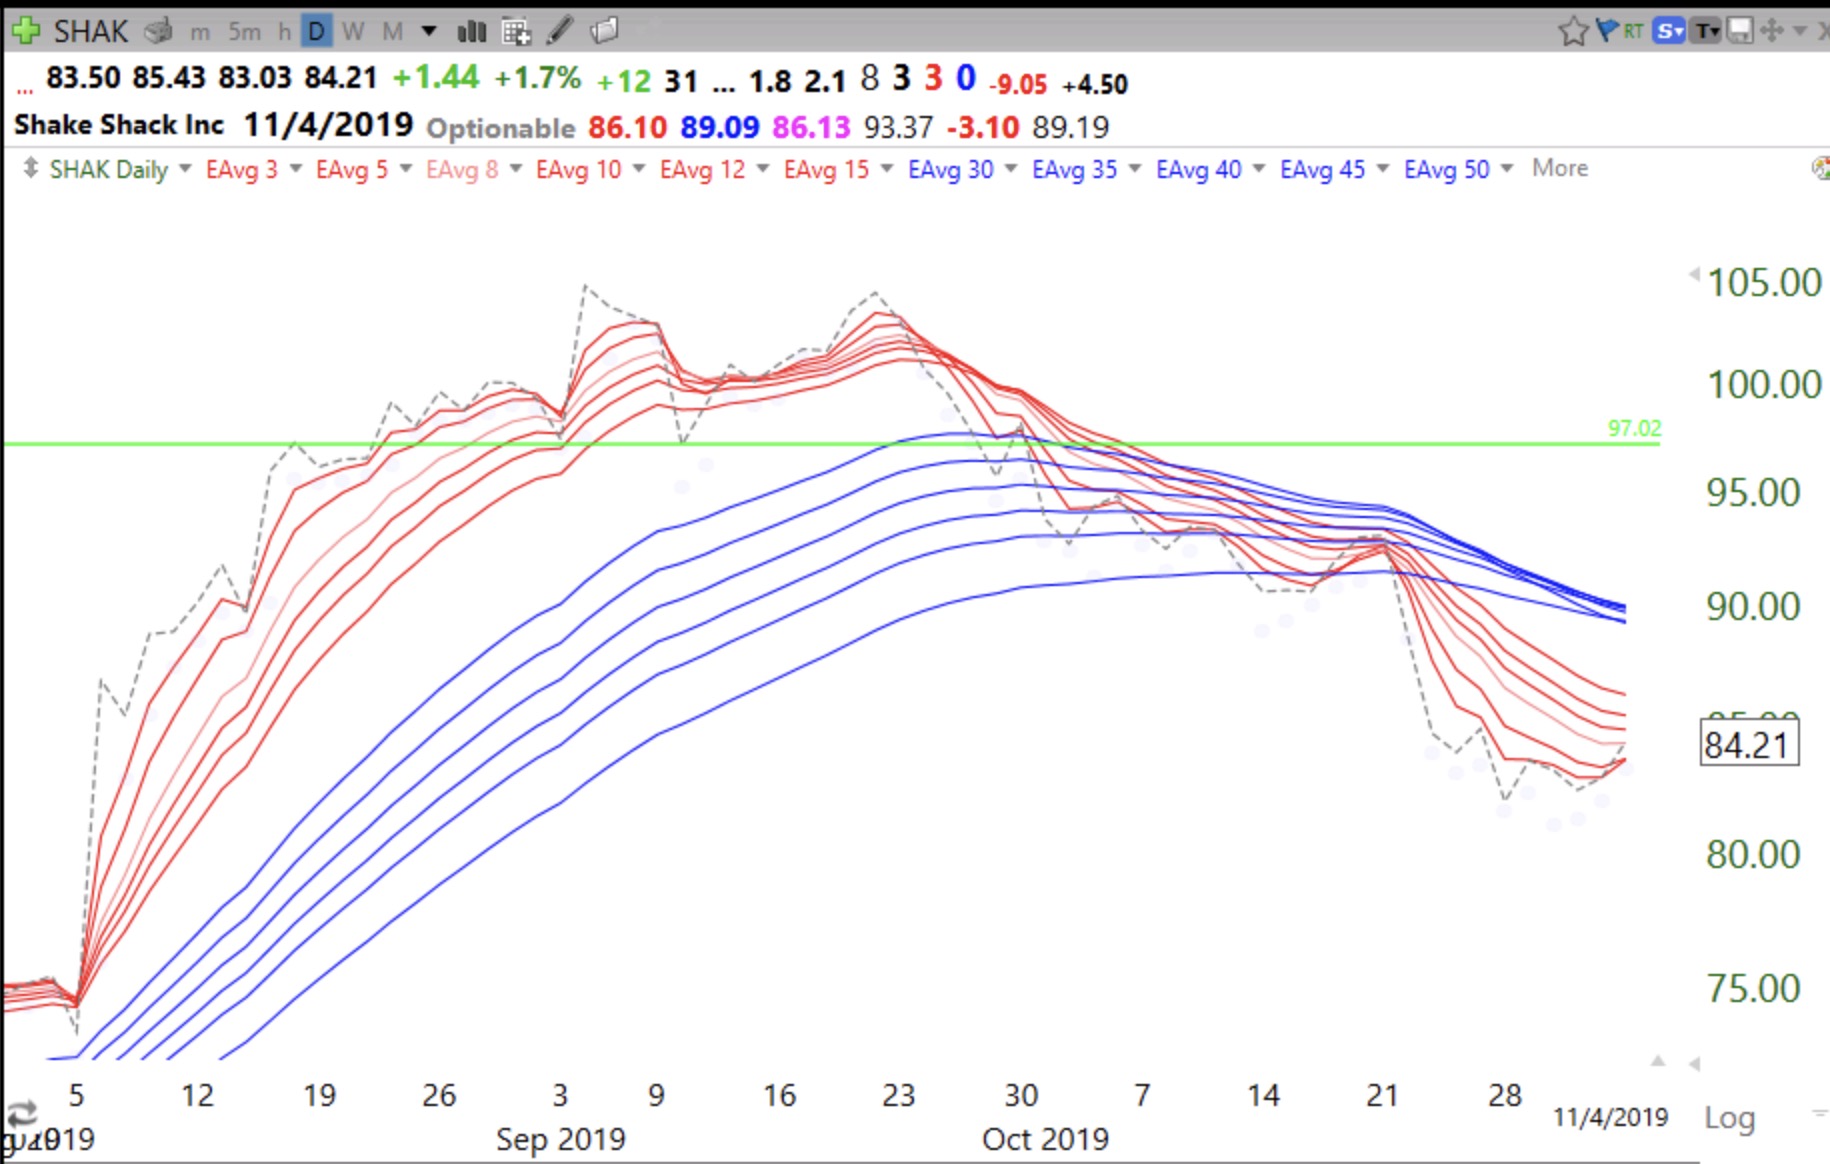
The daily BWR (blue above white space above red) pattern suggested earnings might not be good. Stocks top out before earnings do. I only hold stocks in daily RWB up-trends.
Stock Market Technical Indicators & Analysis
The daily BWR (blue above white space above red) pattern suggested earnings might not be good. Stocks top out before earnings do. I only hold stocks in daily RWB up-trends.
Mark Minervini presented for three hours to my class on Friday, in-person. It was an extraordinary experience. Mark has a huge commitment to advancing financial literacy education for young people.
One of my students has produced tutorials based on my course and loaded them on youtube. Check them out here. Or search for Richard Moglen on youtube. His tweets are available at: @RichardMoglen.
Ever wonder if it pays to look at hourly charts? I have been looking at DOCU as a possible GLB (green line break-out). Below is its daily chart. It shows the stock consolidating below the green line. Note there is nothing unusual in its volume pattern the past few weeks. After the large earnings related spike in early September, volume has been declining. Note the two recent green dot buy signals.
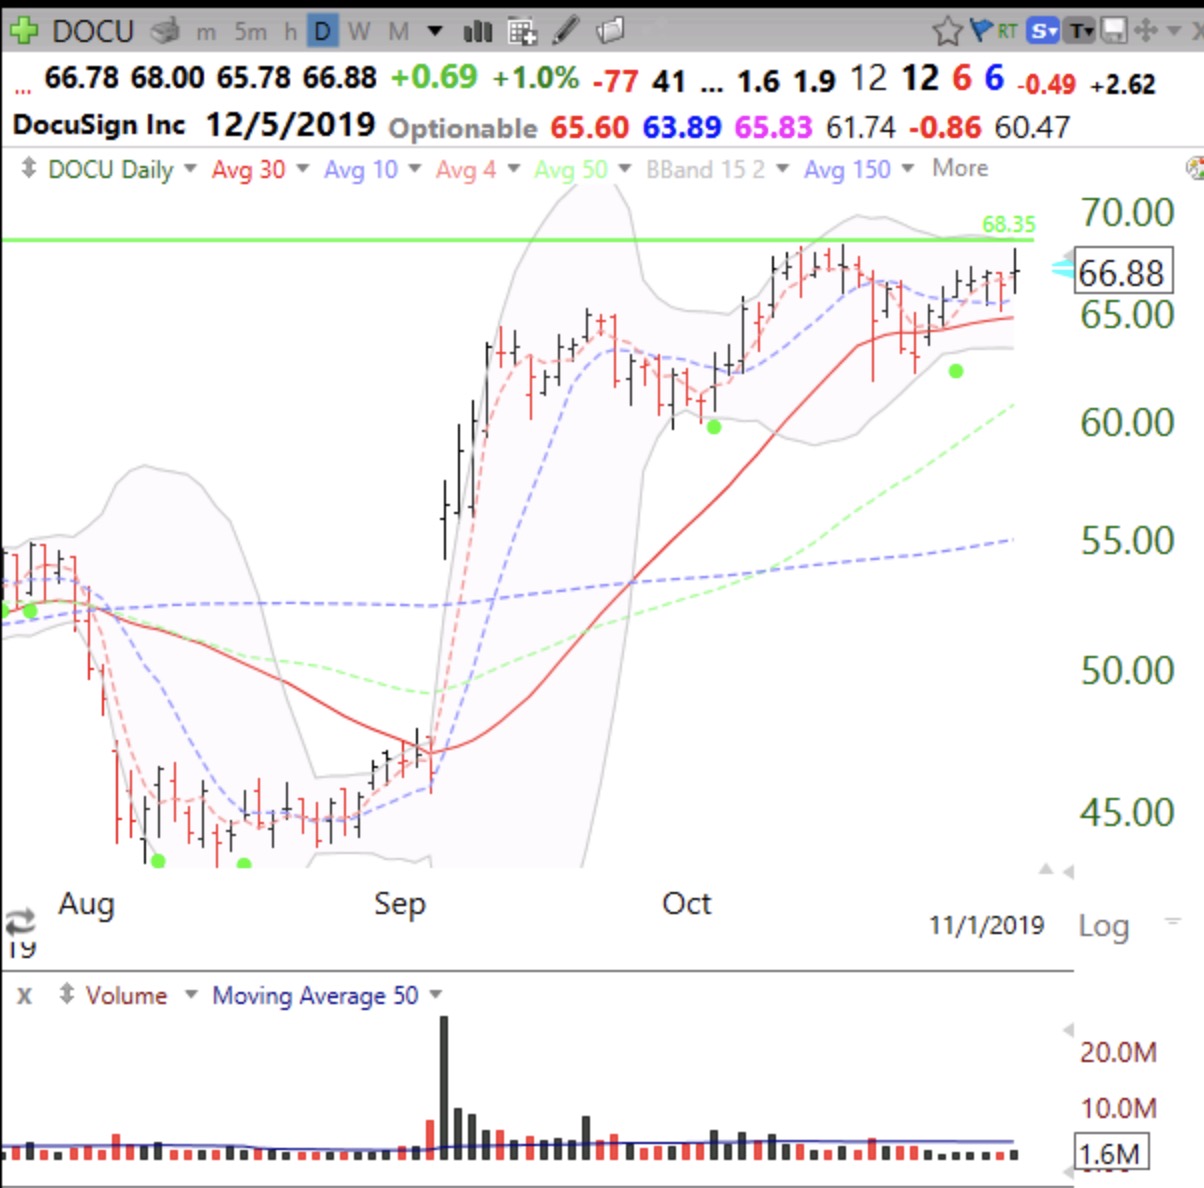
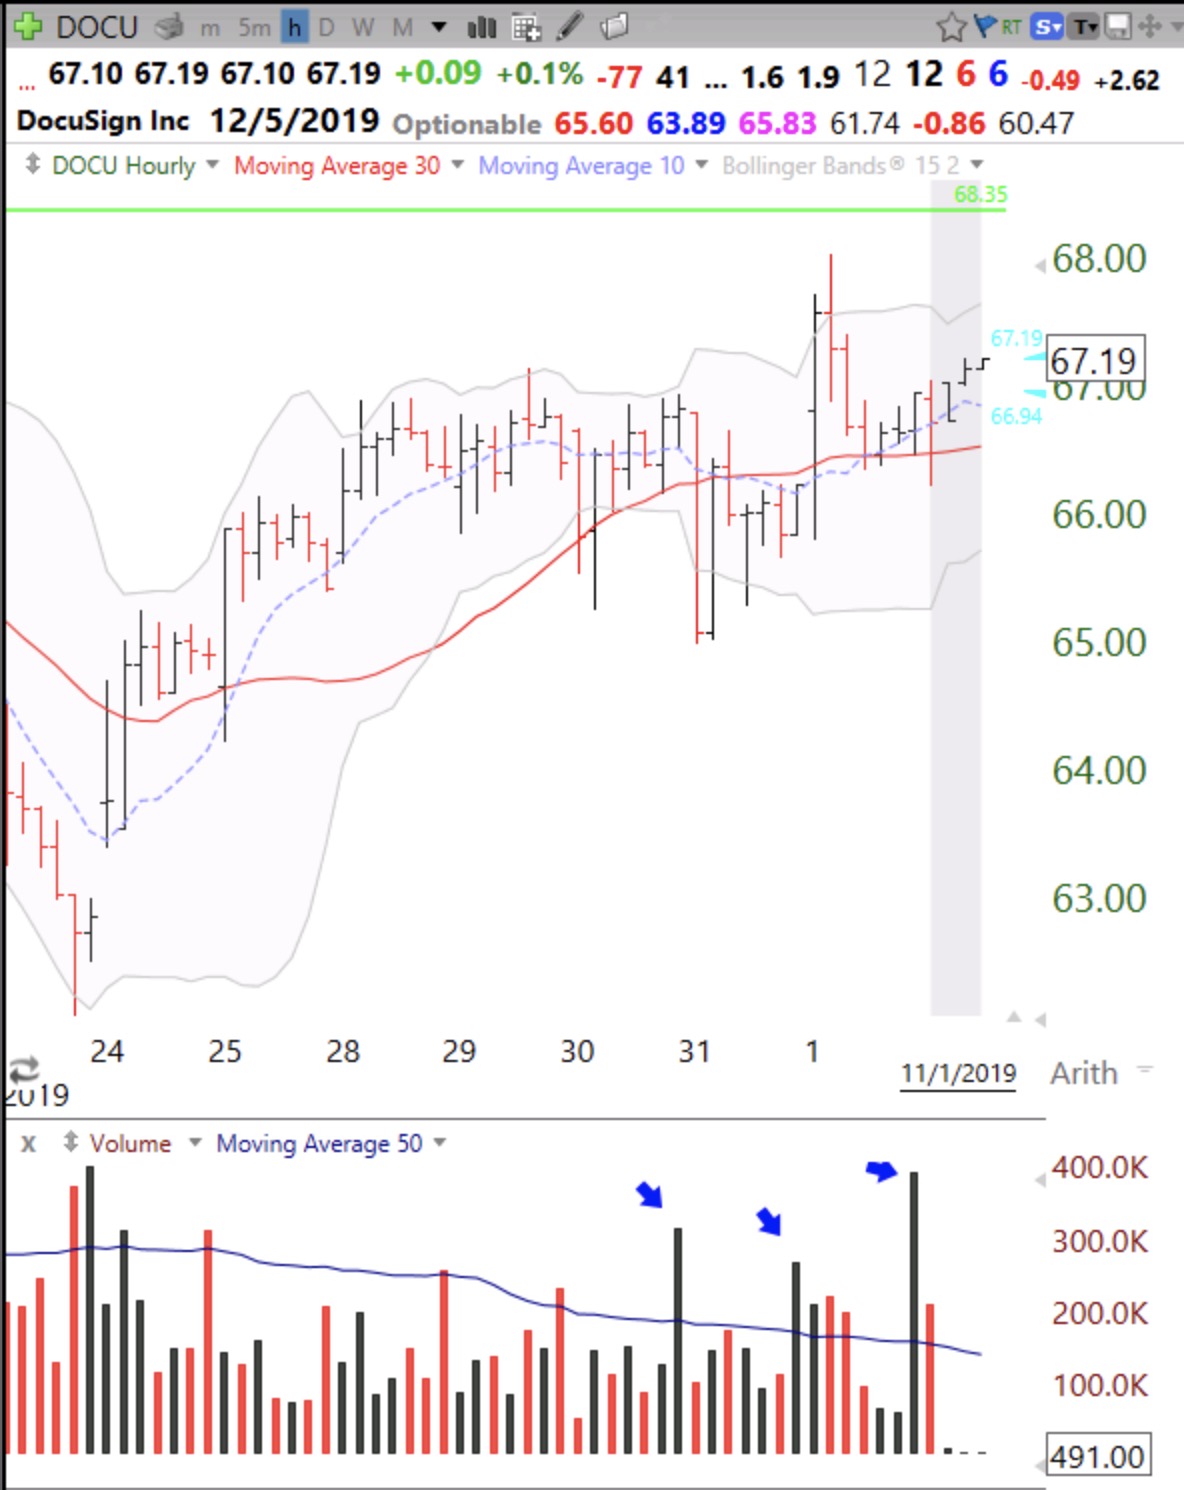
Now look at the hourly chart. You can see 3 clear spikes in volume at the last hour each day, which I marked with arrows. Each of these spikes in buying were not visible in the daily volume charts. Clearly, some big buyers are coming in at the close to accumulate the stock. While this buying does not guarantee a break-out, it does suggest to me that a rise may be imminent.
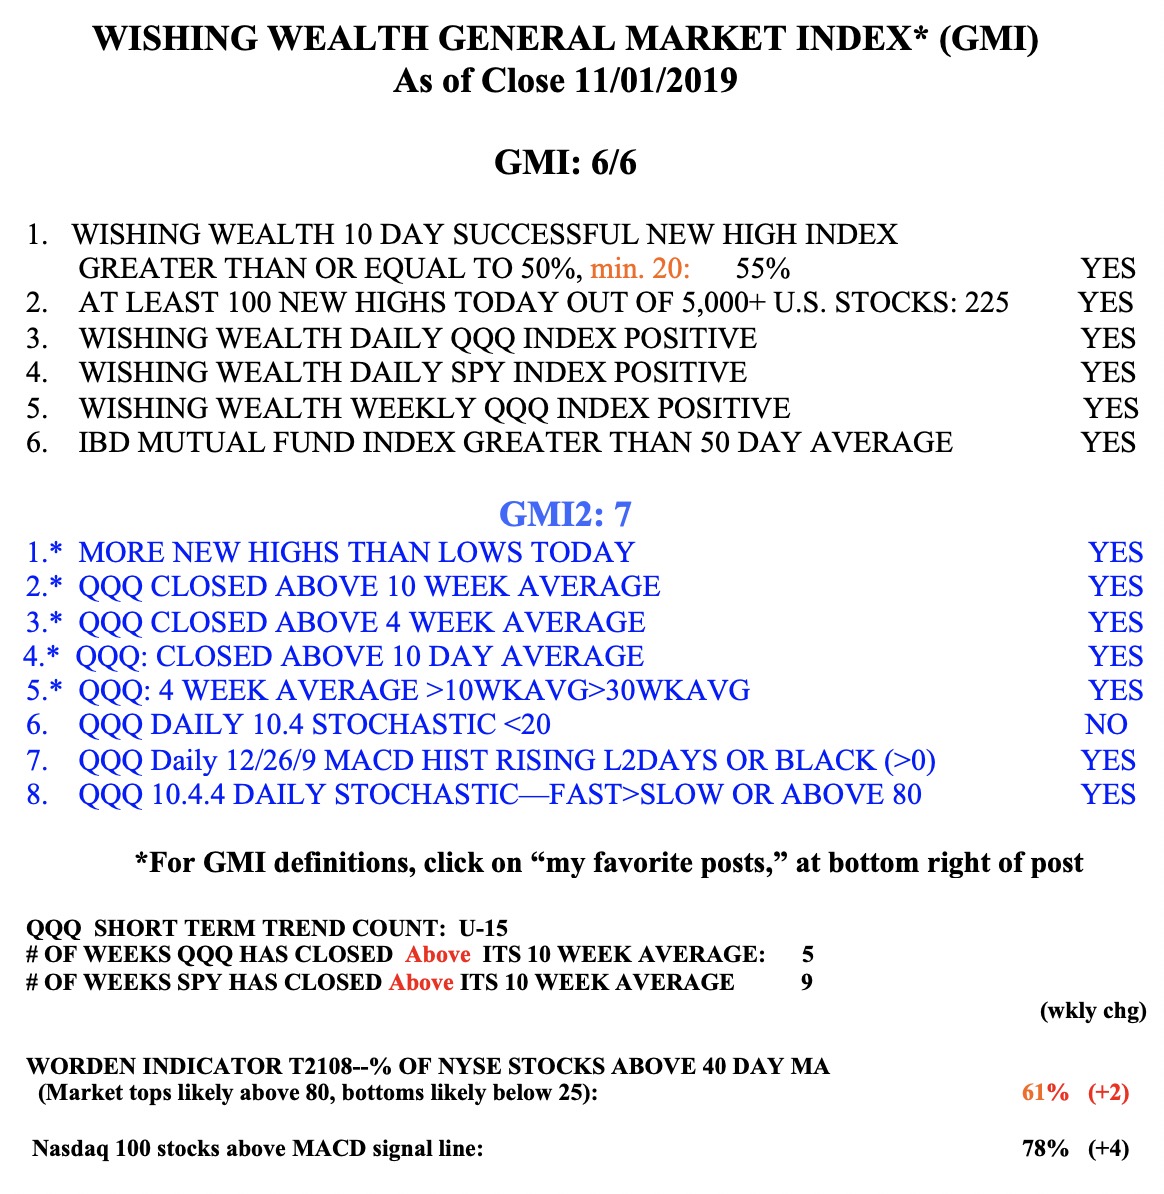
The GMI remains Green and is at 6 (of 6).