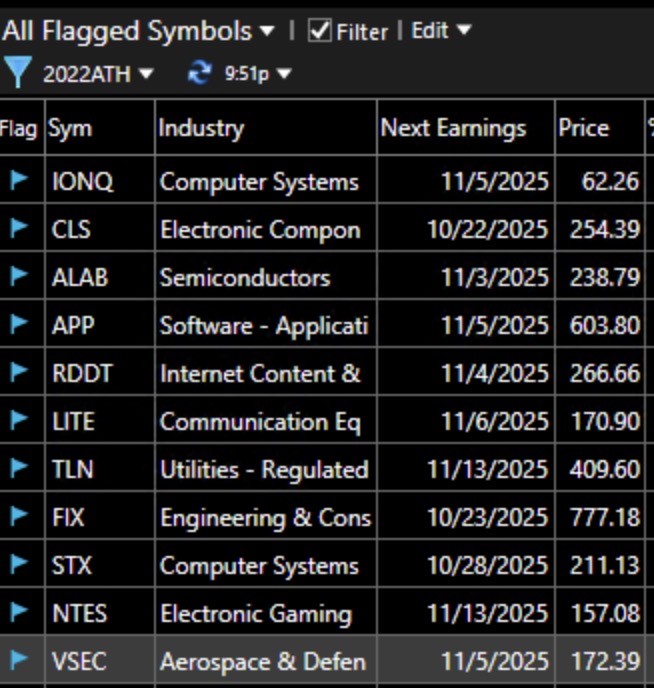
While the GMI is still Red, see table below, a few stocks are breaking out to ATHs, see GS and CRS. CRS reports earnings on 5/1. Neither should close back below their green lines. With the GMI on a Red signal, I am on the sidelines in my trading account.
We want to buy or hold stocks/ETFs that are closing repeatedly (dotted line) above all of the shorter averages (red lines) which in turn should be rising above the longer term averages (blue lines) so that there is a white space between them=RWB pattern. The opposite pattern, BWR, shows a down-trend. BA shows a RWB pattern turning into a BWR pattern. There is no excuse for riding a BWR pattern. This is a daily chart. A weekly chart shows longer term patterns the same way. When the white space disappears it is time to exit until a new trend develops. NFLX and CAVA are also showing signs of weakening. Wait until a stock closes back above all of the red lines. We want the closing prices (dotted line) to be leading the red lines higher.