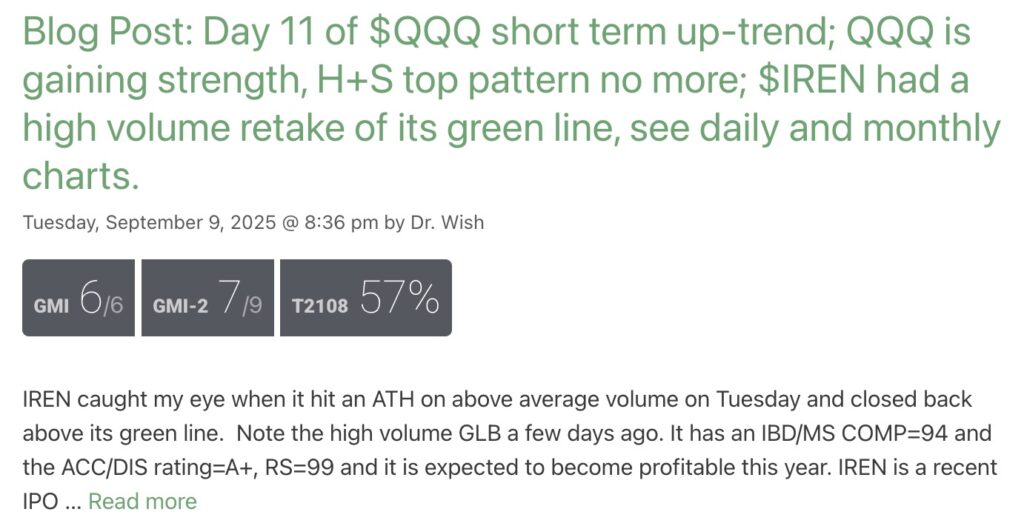
Here is the post from September 9:
Stock Market Technical Indicators & Analysis
Here is the post from September 9:
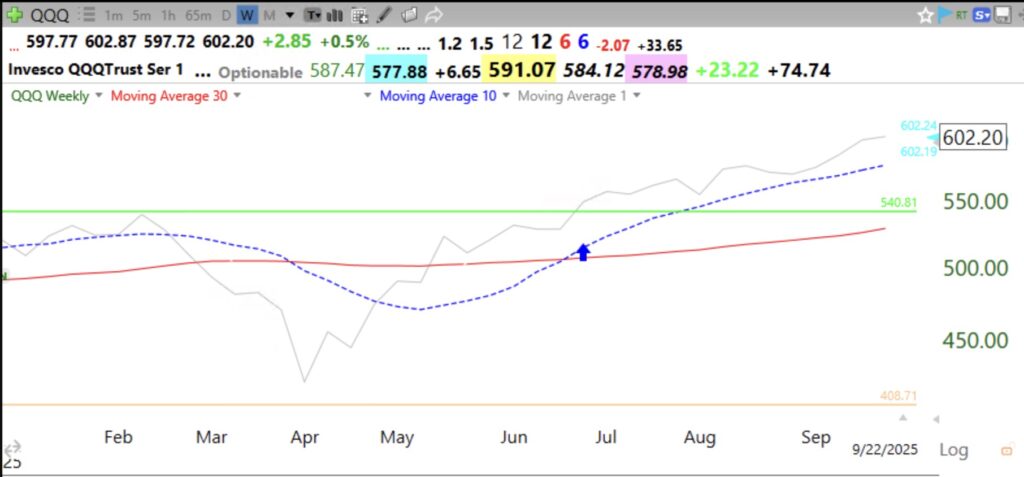
This chart shows the weekly closes (gray line) above the rising 10 week average (blue dotted) which is above the rising 30 week average (red solid). As long as this pattern continues I will stay long. When it fails I will reduce long holdings. I react rather then try to predict. No one knows when a rise will end. And I can exit after a top is evident from the indicators. Stop listening to the media pundits and instead watch the the market’s movements. If one gets out with a close below the 30 week and back in when it retakes it, it can work well. Look at this chart.
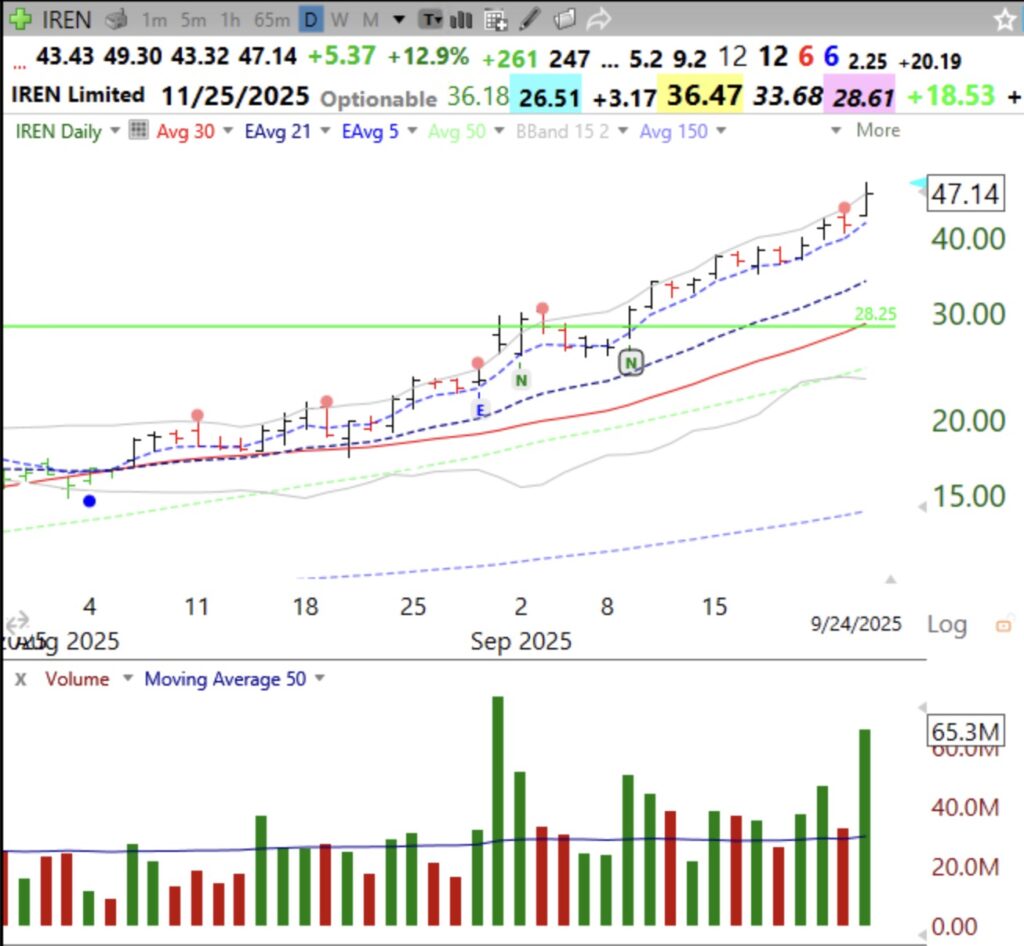
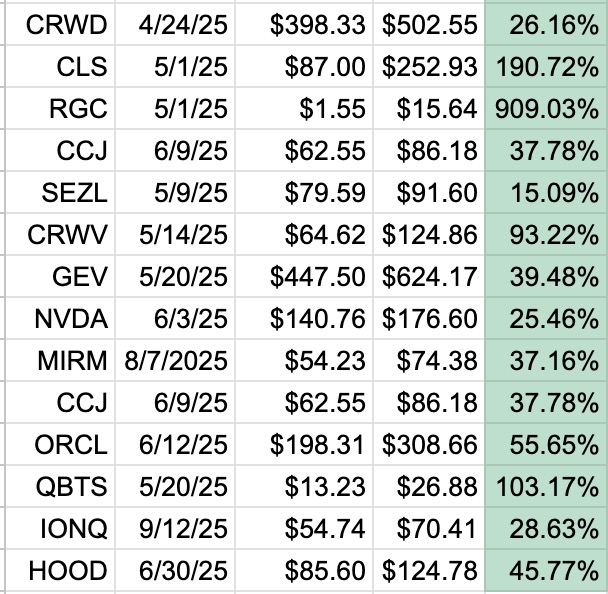
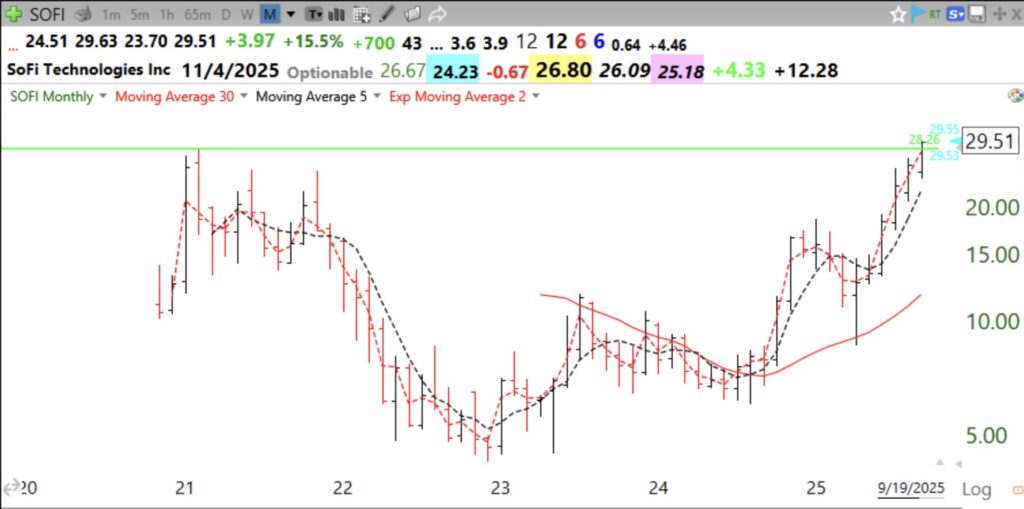
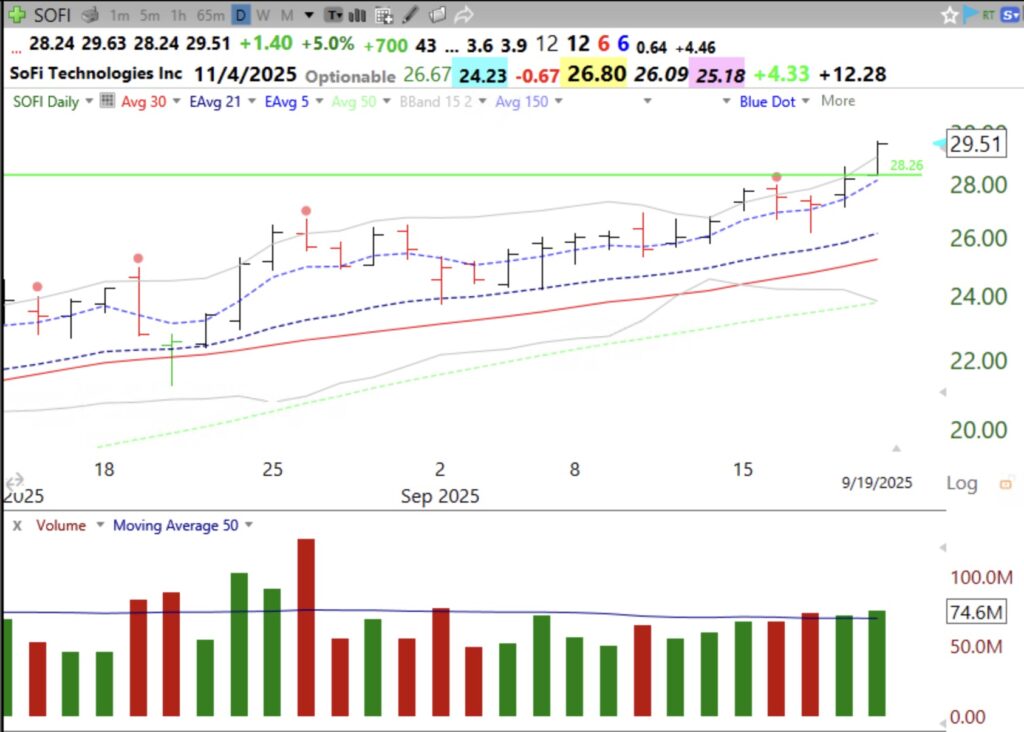
These are some stocks that had a GLB (green line break-out) and kept rising. While not all GLBs are successful, one can buy a GLB immediately and sell if the stock CLOSES back below the green line. That is how to limit losses. Green lines are drawn on a monthly chart at an ATH that is not surpassed for at least 3 months. When the stock then goes to a new ATH, especially on increased trading volume, that is when I like to buy. Below is a list of some successful GLBs in 2025, showing the green line value and last Friday’s close and % increase. After that is a chart of SOFI which had a GLB last Friday, although there was not a large increase in trading volume. SOFI has an IBD COMP rating=99. Check it out.
Here are the monthly and daily charts of SOFI. Green line is at $28.26.
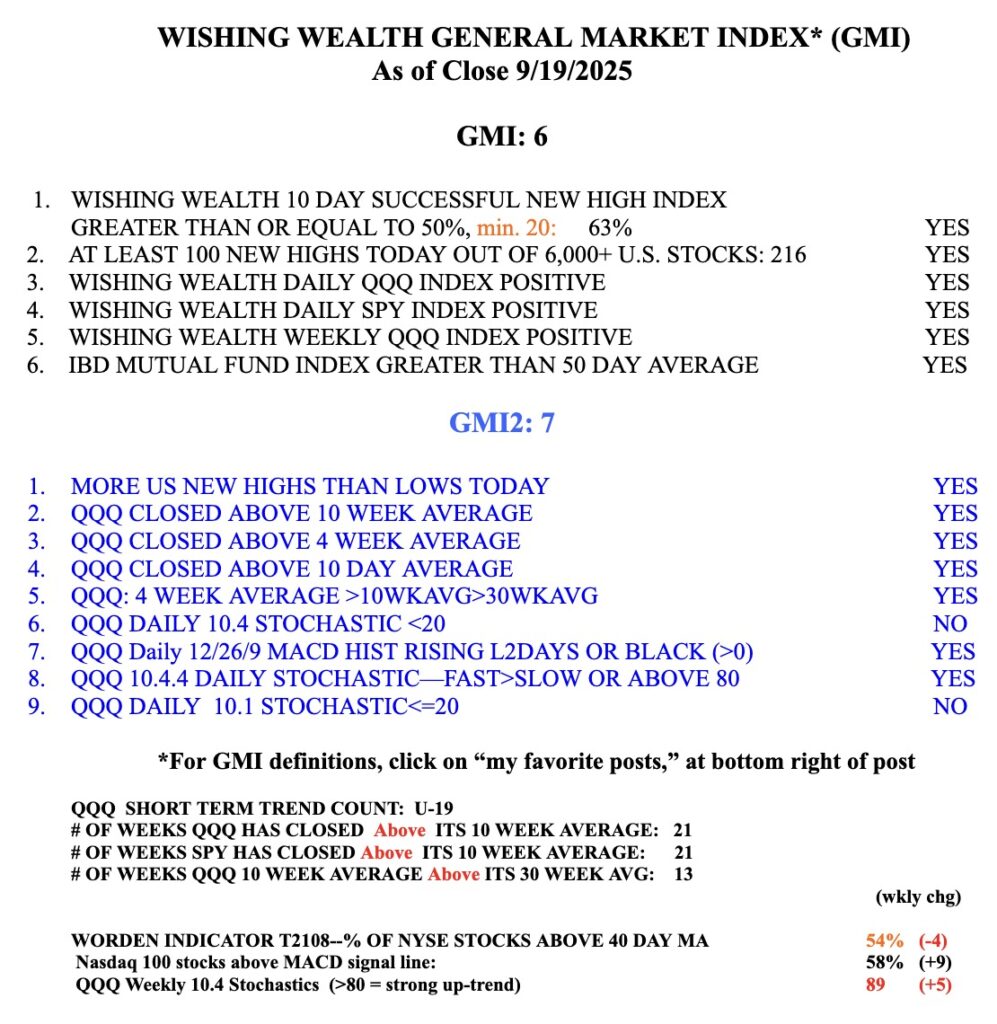
The GMI=6 (of 6).