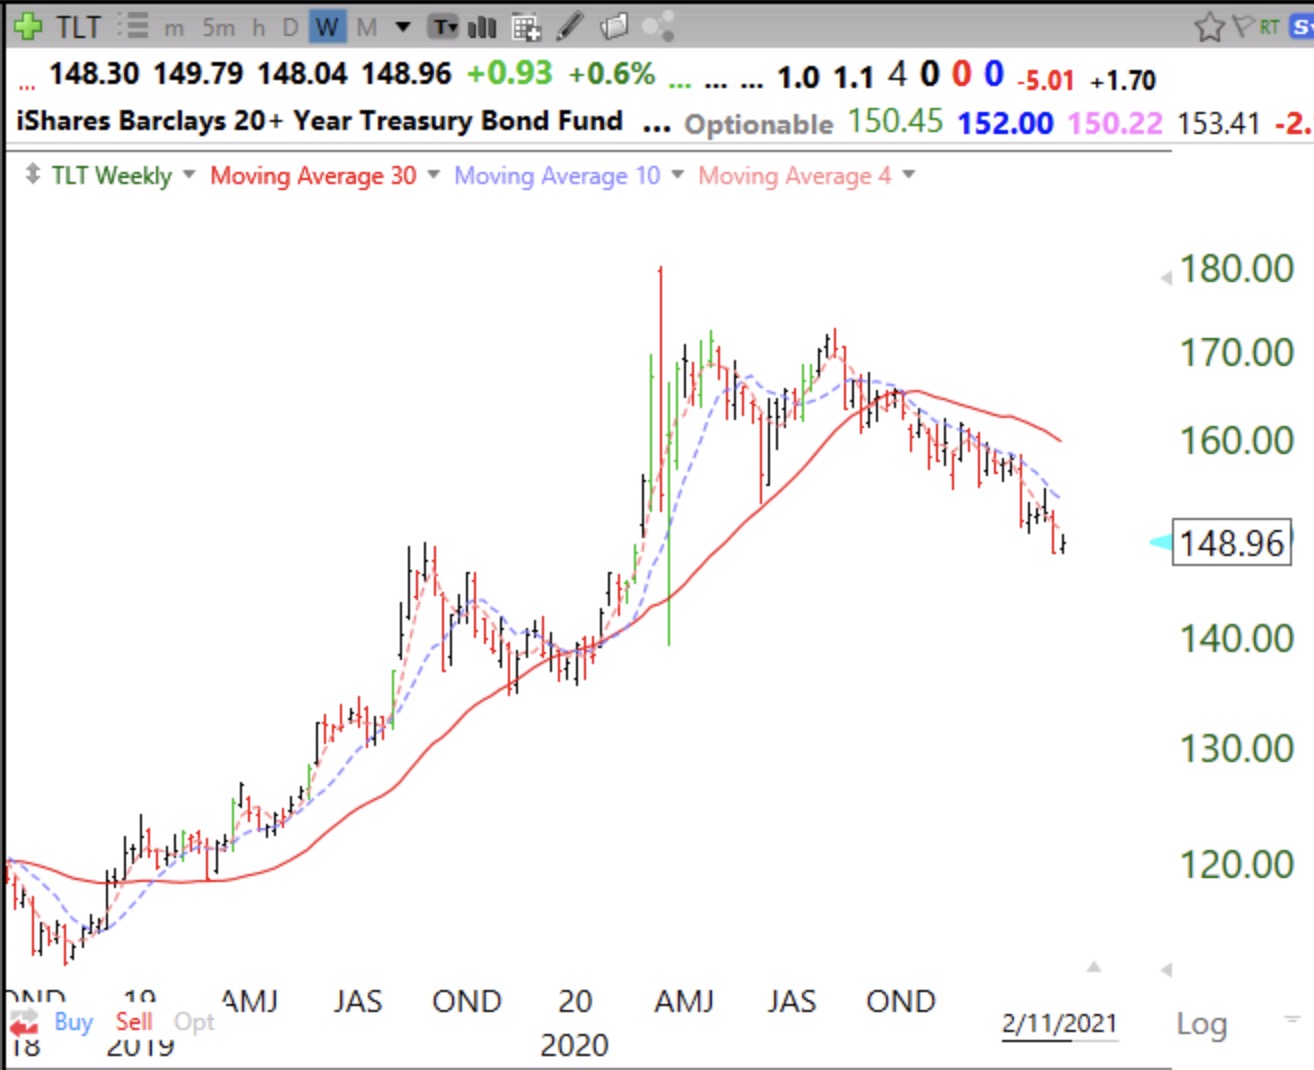
Skip to content

Wishing Wealth Blog

Stock Market Technical Indicators & Analysis

  • Home
  • About
    • Disclaimer
    • Contact
  • Recommended Reading
  • Topics
    • General Market Index (GMI) table
    • Nicolas Darvas
    • My Favorite Posts
    • Tutorial
    • UMDSMC Education Posts
    • Video blog
  • Webinars
    • 2026-04 MoneyShow Virtual Booths
    • TraderLion 25 Annual Conference
    • 2025-07-17 Long Island Traders Meetup
    • Boston IBD Meetup, May 21, 2025
    • 01/2024 NoVA IBD Meetup
    • AAII
      • Eastern Michigan – 01/2022
      • Research Triangle – 12/2021
    • 2021 TraderLion Presentation
    • 2022 TraderLion Webinar
    • TC2000 User Group – December 2012
    • 2012 Houston TC2000 Webinar
    • Doctor’s Orders – August 2010
    • A Word from Dr. Wish – April 2010
    • Other Dr. Wish Videos…
  • Glossary
  • $25 Coupon for TC2000

The GMI remains at 6 (of 6) and Green; and this chart shows the GMI kept me on the right side of the market during all major declines since 2006

Sunday, December 20, 2020 @ 9:37 pm by Dr. Wish
GMI6/6
GMI-27/9
T210880%

I also escaped the 2000 debacle.


2 Comments

GMI signals get me in and out of QQQ; 30th day of $QQQ short term up-trend;

Thursday, December 17, 2020 @ 10:12 pm by Dr. Wish
GMI6/6
GMI-27/9
T210883%

1 Comment

$ATVI moving up after GLB; expected end of quarter rally is upon us

Thursday, December 17, 2020 @ 9:03 am by Dr. Wish
GMI6/6
GMI-27/9
T210880%

2 Comments
Older posts
Newer posts
← Previous Page1 … Page358 Page359 Page360 Page361 Page362 Page363 Page364 … Page1,552 Next →

Current GMI Signal

GREEN

since close on APR 10, 2026

Successful GLBTracker

Selected stocks that have had a successful recent Green Line Breakout (GLB). One can really profit by buying stocks breaking out to all-time highs after a consolidation of 3 months or more, my GLB Setup.

Sym.DateGLB $Now $Chg.
ENLT6/18/25$20.44$89.97340.17%
SFM1/29/24$49.45$85.2072.30%
CRS4/23/24$79.66$417.97424.69%
AGX9/6/24$76.70$657.68757.47%
SATS8/26/25$50.21$123.97146.90%
APP9/17/24$116.09$485.45318.17%
EAT10/1/24$78.33$139.1877.68%
PLTR11/5/24$44.91$134.47199.42%
ALMS1/6/26$13.53$23.1170.81%
BE8/22/25$44.95$270.46501.69%
CLS5/1/25$87.00$362.48316.64%
RGC5/1/25$1.55$25.701558.06%
CCJ6/9/25$62.55$113.9582.17%
RHLD8/12/25$54.05$106.0296.15%
GEV5/20/25$447.50$1,044.33133.37%
CLS6/25/25$144.27$362.48151.25%
MIRM8/7/2025$54.23$104.1592.05%
CCJ6/9/25$62.55$113.9582.17%
WDC9/4/25$86.66$473.67446.58%
SNDK9/4/25$58.36$1,388.602279.37%
STX6/3/2025$117.67$772.43556.44%
TTMI6/3/25$30.41$150.65395.40%
MU9/29/25$157.54$716.68354.92%
INBX7/8/25$18.95$102.42440.47%
SPHR9/11/25$56.08$129.00130.03%
FIX7/24/25$553.09$1,955.53253.56%

Indicators in your Inbox

Get new posts by email:
PopularMost DiscussedRecent
  • About the General Market Index (GMI)
  • Welcome to the new *and improved* Wishing Wealth
  • How to use IBD 100 and New America stocks and TC2007 to find potential rocket stocks; Market rally begins
  • The new 3x ETF’s–triple your pleasure — or pain
  • 6th day of $QQQ short term down-trend; GMI could signal a Buy
  • In the hospital. Will resume posting next week. Thank you for your patience.
  • How I use put options as investment insurance
  • My first YouTube Vlog (video blog) Post: Sell in May and Go Away?
  • So, Wishing Wealth Reader, Tell Us About Yourself…
  • Blog post: David, my co-presenter, brilliant colleague of 20+ years died in a freak accident on 2/18; Day 35 of $QQQ short term down-trend; 15 promising stocks to monitor
  • Blog Post: Day 23 of QQQ short term up-trend; $RKLB rockets higher after large volume GLB, see its daily chart and also the chart of NASA.
  • Blog Post: Day 22 of $QQQ short term up-trend; QQQ 10 wk avg now closes week above 30 wk avg; GMI=GREEN; GLB breakouts are rocketing higher! Ignore the fearful pundits’ predictions. Just watch the markets. See the miraculous 5 day EMA post GLB. Charts: QQQ, INTC, AMD, CHAT.
  • Blog Post: Day 21 of $QQQ short term up-trend; Recent IPO, LIFE, has high volume follow through after its recent GLB, up 32%.
  • Blog Post: Day 19 of $QQQ short term up-trend; 10:30 weekly chart of QQQ shows 10 week average back above rising 30 week average–a major sign of strength.
  • Blog Post: Day 17 of $QQQ short term up-trend; INTC has successful GLB while NVDA has a failed GLB, see daily charts; chart of NBIS looks promising.

Blogroll

  • Barchart All-Time Highs
  • Blue Collar Investor
  • CNNMoney: Pre-market Futures
  • Dark Liquidity
  • Seeking Alpha
  • Stock Chartist

Recommended Reading

QQQ and TQQQ ETF Profit Machine Momentum Masters - A Roundtable Interview with Super Traders - Minervini, Ryan, Zanger & Ritchie II Alan Ellman's Selling Cash-Secured Puts: Investing to Generate Monthly Cash Flow Stock Investing For Students - a plan to get rich slowly and retire young Trade Like a Stock Market Wizard: How to Achieve Super Performance in Stocks in Any Market Exit Strategies for Covered Call Writing: Making the Most Money When Selling Stock Options Complete Encyclopedia for Covered Call Writing Wall Street The Other Las Vegas How to Make Money in Stocks: A Winning System in Good Times and Bad, Fourth Edition Trend Trading: A seven step approach to success How Legendary Traders Made Millions: Profiting From the Investment Strategies of the Gretest Traders of All time The Complete TurtleTrader: The Legend, the Lessons, the Results How to Make Money Selling Stocks Short Reminiscences of a Stock Operator Stan Weinstein's Secrets For Profiting in Bull and Bear Markets Lessons from the Greatest Stock Traders of All Time How I Made $2,000,000 In The Stock Market

Archives

© 2026 WishingWealthBlog.com
 

Loading Comments...