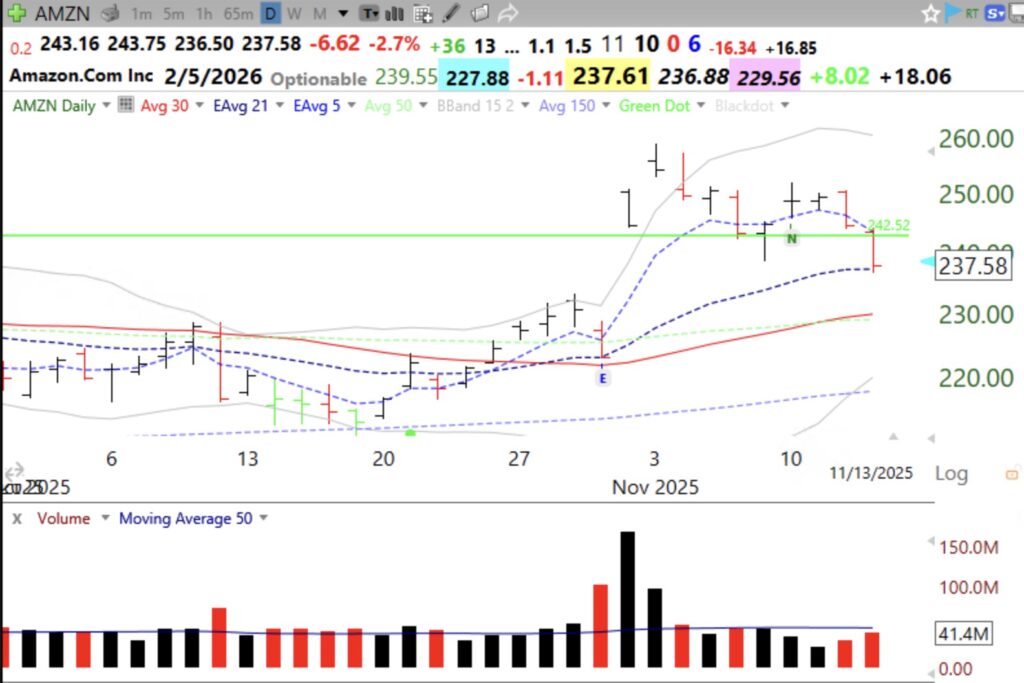
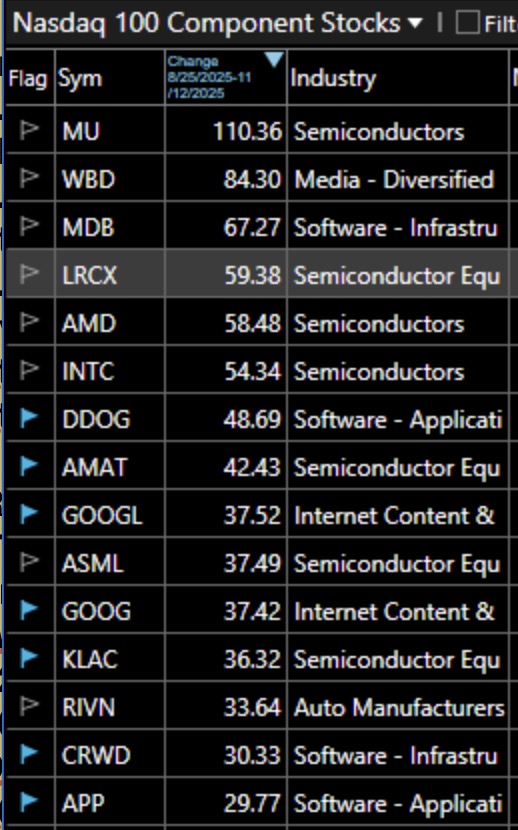
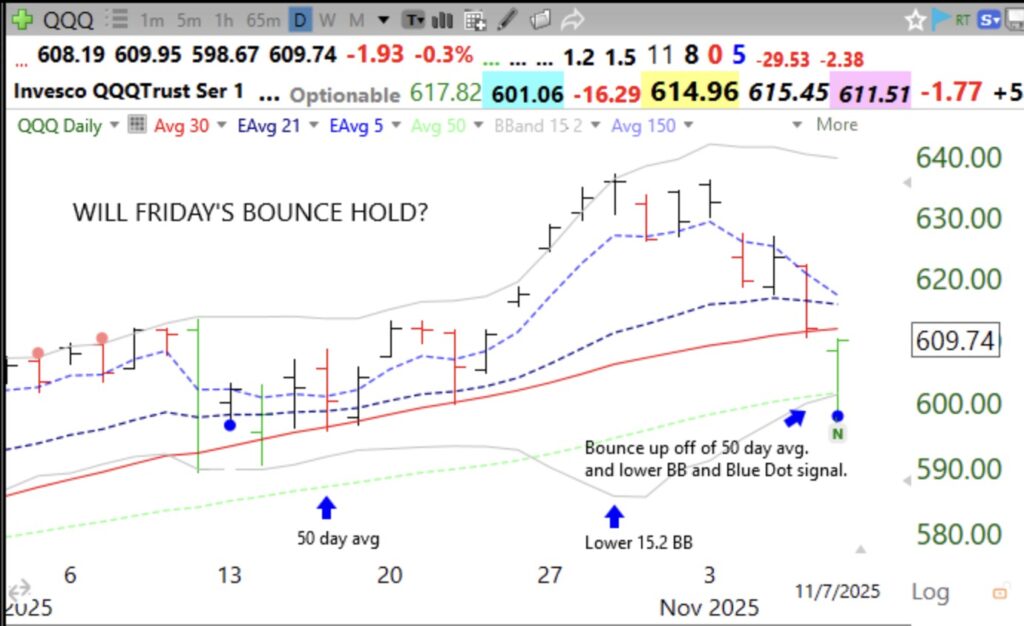
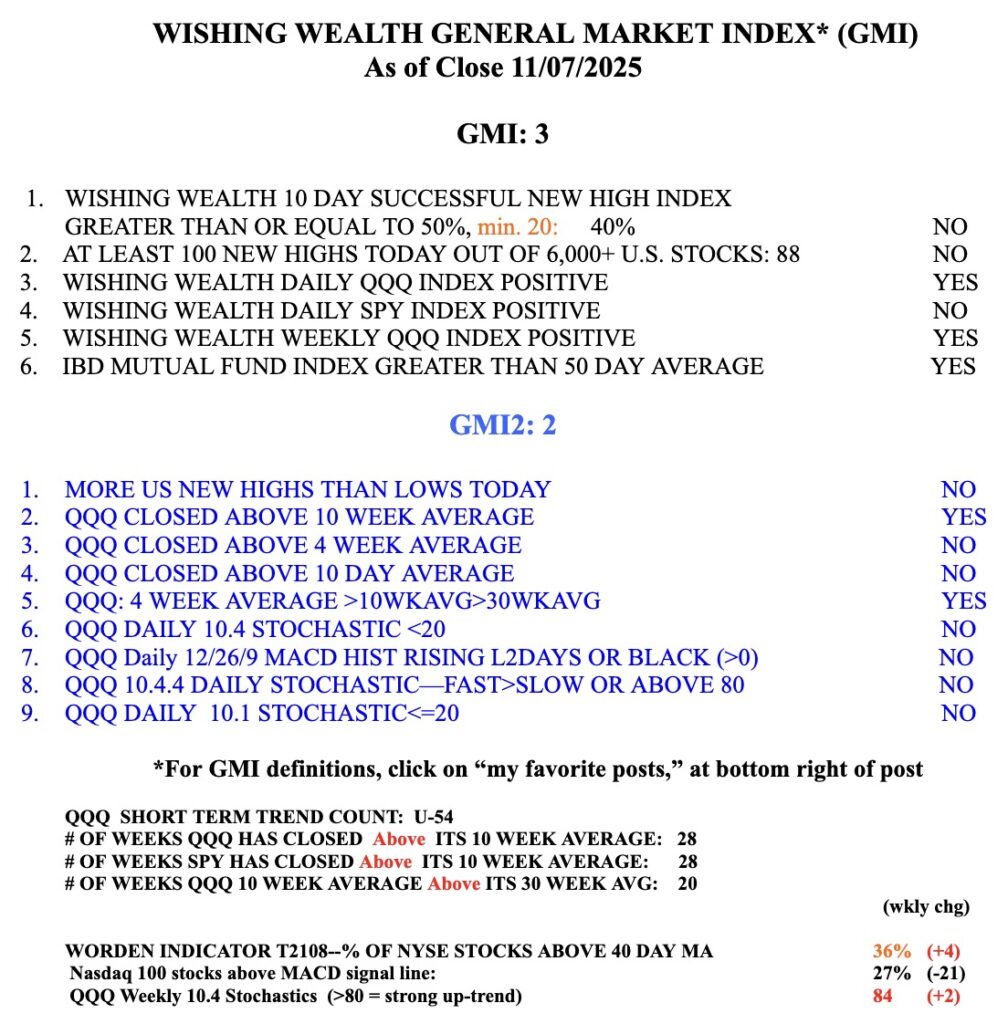
Skip to content

Wishing Wealth Blog

Stock Market Technical Indicators & Analysis

  • Home
  • About
    • Disclaimer
    • Contact
  • Recommended Reading
  • Topics
    • General Market Index (GMI) table
    • Nicolas Darvas
    • My Favorite Posts
    • Tutorial
    • UMDSMC Education Posts
    • Video blog
  • Webinars
    • 2026-04 MoneyShow Virtual Booths
    • TraderLion 25 Annual Conference
    • 2025-07-17 Long Island Traders Meetup
    • Boston IBD Meetup, May 21, 2025
    • 01/2024 NoVA IBD Meetup
    • AAII
      • Eastern Michigan – 01/2022
      • Research Triangle – 12/2021
    • 2021 TraderLion Presentation
    • 2022 TraderLion Webinar
    • TC2000 User Group – December 2012
    • 2012 Houston TC2000 Webinar
    • Doctor’s Orders – August 2010
    • A Word from Dr. Wish – April 2010
    • Other Dr. Wish Videos…
  • Glossary
  • $25 Coupon for TC2000

Blog Post: Day 16 of $QQQ short term up-trend; See list of 14 doublers that reached an ATH on Tuesday.

Tuesday, September 16, 2025 @ 10:01 pm by Dr. Wish
GMI6/6
GMI-27/9
T210855%

The leaders show up among those hitting all-time highs (ATHs). This list shows growth stocks that reached an ATH on Tuesday and that are at least twice their prices a year ago.The list is sorted by change from a year ago. IONQ is 8x its price a year ago. Check them out.

Screenshot


1 Comment

Blog Post: Day 14 of $QQQ short term up-trend; $IREN had recent GLB and has strong fundamentals, see daily and monthly charts; GMI=6 (of 6)

Sunday, September 14, 2025 @ 10:01 pm by Dr. Wish
GMI6/6
GMI-27/9
T210858%

IREN has high volume advances and is trending with its 5 EMA. It is almost 5x its price a year ago. It has strong fundamentals, check it out. Below are its daily and monthly charts. It must not CLOSE below green line @28.25.

Screenshot
Leave a comment

Blog Post: Day 13 of $QQQ short term up-trend; Many stocks at ATHs. $NET had an above average GLB, must not CLOSE below green line @221.64, see daily and monthly charts.

Thursday, September 11, 2025 @ 11:00 pm by Dr. Wish
GMI6/6
GMI-27/9
T210863%
Screenshot
Screenshot
Leave a comment
Older posts
Newer posts
← Previous Page1 … Page32 Page33 Page34 Page35 Page36 Page37 Page38 … Page1,555 Next →

Current GMI Signal

GREEN

since close on APR 10, 2026

Successful GLBTracker

Selected stocks that have had a successful recent Green Line Breakout (GLB). One can really profit by buying stocks breaking out to all-time highs after a consolidation of 3 months or more, my GLB Setup.

Sym.DateGLB $Now $Chg.
ENLT6/18/25$20.44$90.11340.85%
SFM1/29/24$49.45$84.7371.34%
CRS4/23/24$79.66$522.22555.56%
AGX9/6/24$76.70$592.59672.61%
SATS8/26/25$50.21$114.26127.56%
APP9/17/24$116.09$498.32329.25%
EAT10/1/24$78.33$147.2788.01%
PLTR11/5/24$44.91$130.42190.40%
ALMS1/6/26$13.53$20.3150.11%
BE8/22/25$44.95$233.13418.64%
CLS5/1/25$87.00$360.27314.10%
RGC5/1/25$1.55$20.681234.19%
CCJ6/9/25$62.55$94.7951.54%
RHLD8/12/25$54.05$119.36120.83%
GEV5/20/25$447.50$859.1691.99%
CLS6/25/25$144.27$360.27149.72%
MIRM8/7/2025$54.23$94.1673.63%
CCJ6/9/25$62.55$94.7951.54%
WDC9/4/25$86.66$490.74466.28%
SNDK9/4/25$58.36$1,640.392710.81%
STX6/3/2025$117.67$813.23591.11%
TTMI6/3/25$30.41$168.63454.52%
MU9/29/25$157.54$887.38463.27%
INBX7/8/25$18.95$89.28371.13%
SPHR9/11/25$56.08$142.71154.48%
FIX7/24/25$553.09$1,725.16211.91%

Indicators in your Inbox

Get new posts by email:
PopularMost DiscussedRecent
  • About the General Market Index (GMI)
  • Welcome to the new *and improved* Wishing Wealth
  • How to use IBD 100 and New America stocks and TC2007 to find potential rocket stocks; Market rally begins
  • The new 3x ETF’s–triple your pleasure — or pain
  • 6th day of $QQQ short term down-trend; GMI could signal a Buy
  • In the hospital. Will resume posting next week. Thank you for your patience.
  • How I use put options as investment insurance
  • My first YouTube Vlog (video blog) Post: Sell in May and Go Away?
  • So, Wishing Wealth Reader, Tell Us About Yourself…
  • Blog post: David, my co-presenter, brilliant colleague of 20+ years died in a freak accident on 2/18; Day 35 of $QQQ short term down-trend; 15 promising stocks to monitor
  • Blog: Day 43 of $QQQ short term up-trend, it could end on Wednesday; Longer term up-trend remains, see weekly chart. QQQ has found support at its rising 10 week average, but is below its 4 week. Note how long it held its rising 4 week average, quite a rally.
  • Blog: Day 41 of $QQQ short term up-trend, it may end on Monday; Longer term up-trend still intact., GMI=6 (of 6).
  • The same chart pattern I posted yesterday for the 2000 top also got me out of the market just before the 2008 decline. Market tops take time to develop. I ignore the news and gossip and watch the 30 week average.
  • HOW I IDENTIFIED AND EXITED AT THE MARKET TOP IN 2000–WHEN THE 30 WEEK AVERAGE CURVED DOWN. TO IDENTIFY A LIKELY TOP, I JUST WATCH THE 30 WEEK AVERAGE. Compare the weekly charts of QQQ from 2000 and now.
  • Blog: Day 36 of QQQ short term up-trend; I am amazed how strongly advancing stocks and ETFs may track along their 5 day exponential moving average, see daily charts of QQQ and DELL.

Blogroll

  • Barchart All-Time Highs
  • Blue Collar Investor
  • CNNMoney: Pre-market Futures
  • Dark Liquidity
  • Seeking Alpha
  • Stock Chartist

Recommended Reading

QQQ and TQQQ ETF Profit Machine Momentum Masters - A Roundtable Interview with Super Traders - Minervini, Ryan, Zanger & Ritchie II Alan Ellman's Selling Cash-Secured Puts: Investing to Generate Monthly Cash Flow Stock Investing For Students - a plan to get rich slowly and retire young Trade Like a Stock Market Wizard: How to Achieve Super Performance in Stocks in Any Market Exit Strategies for Covered Call Writing: Making the Most Money When Selling Stock Options Complete Encyclopedia for Covered Call Writing Wall Street The Other Las Vegas How to Make Money in Stocks: A Winning System in Good Times and Bad, Fourth Edition Trend Trading: A seven step approach to success How Legendary Traders Made Millions: Profiting From the Investment Strategies of the Gretest Traders of All time The Complete TurtleTrader: The Legend, the Lessons, the Results How to Make Money Selling Stocks Short Reminiscences of a Stock Operator Stan Weinstein's Secrets For Profiting in Bull and Bear Markets Lessons from the Greatest Stock Traders of All Time How I Made $2,000,000 In The Stock Market

Archives

© 2026 WishingWealthBlog.com

Loading Comments...