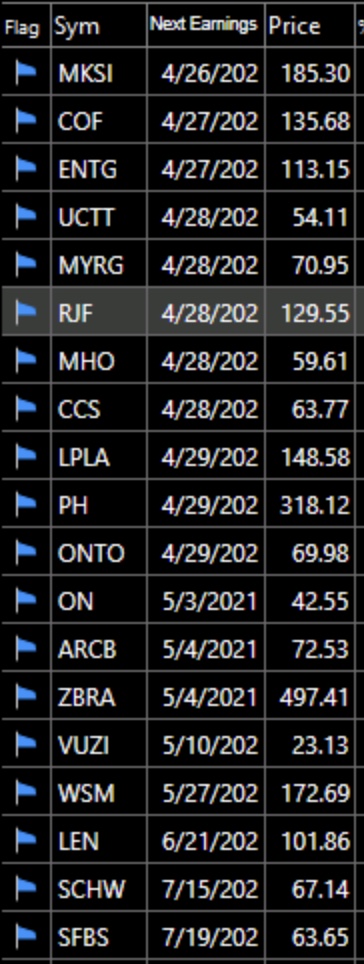
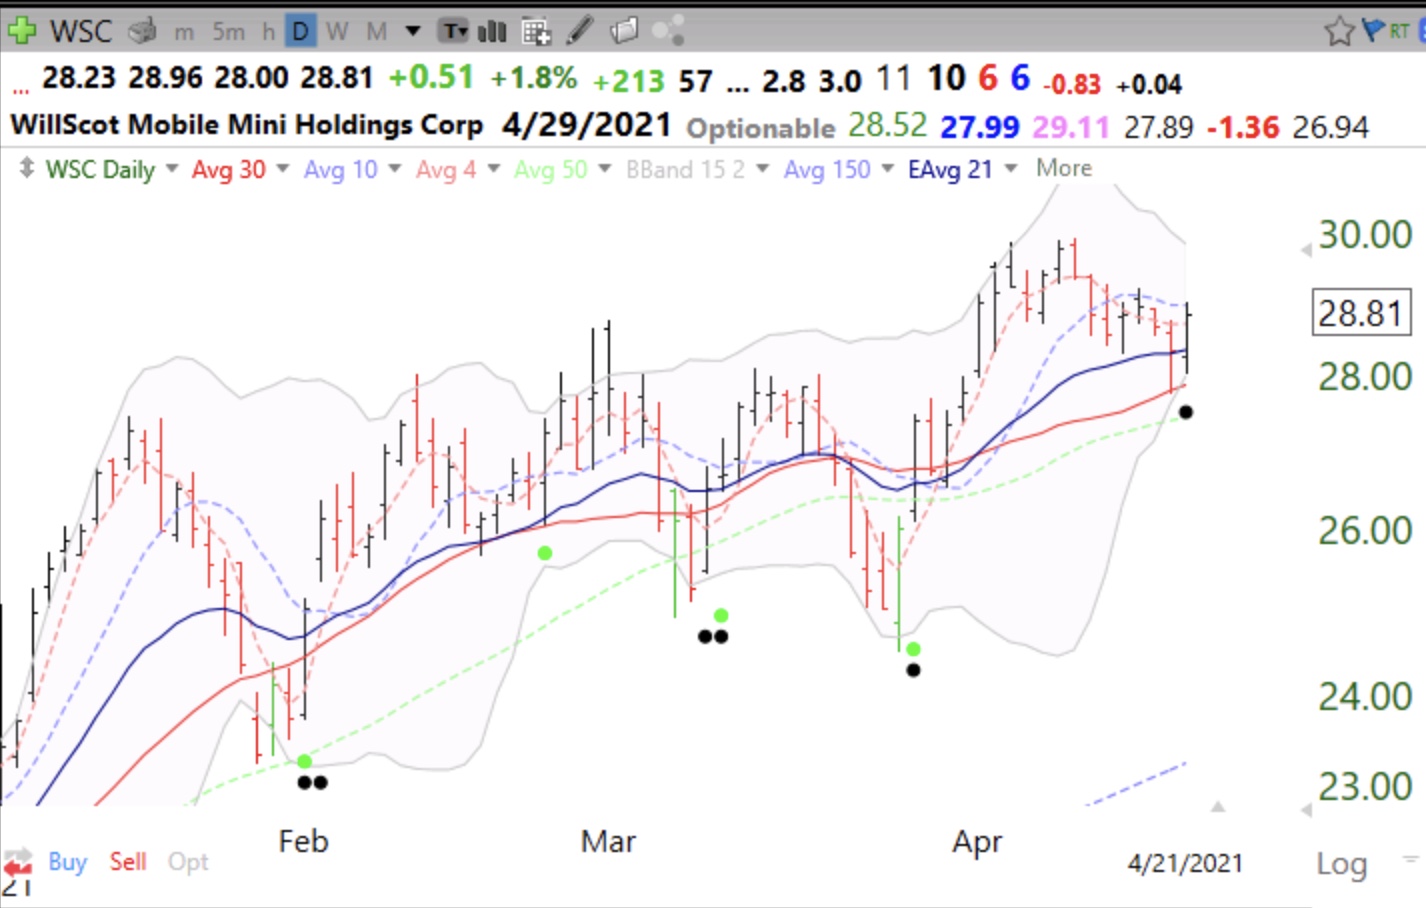
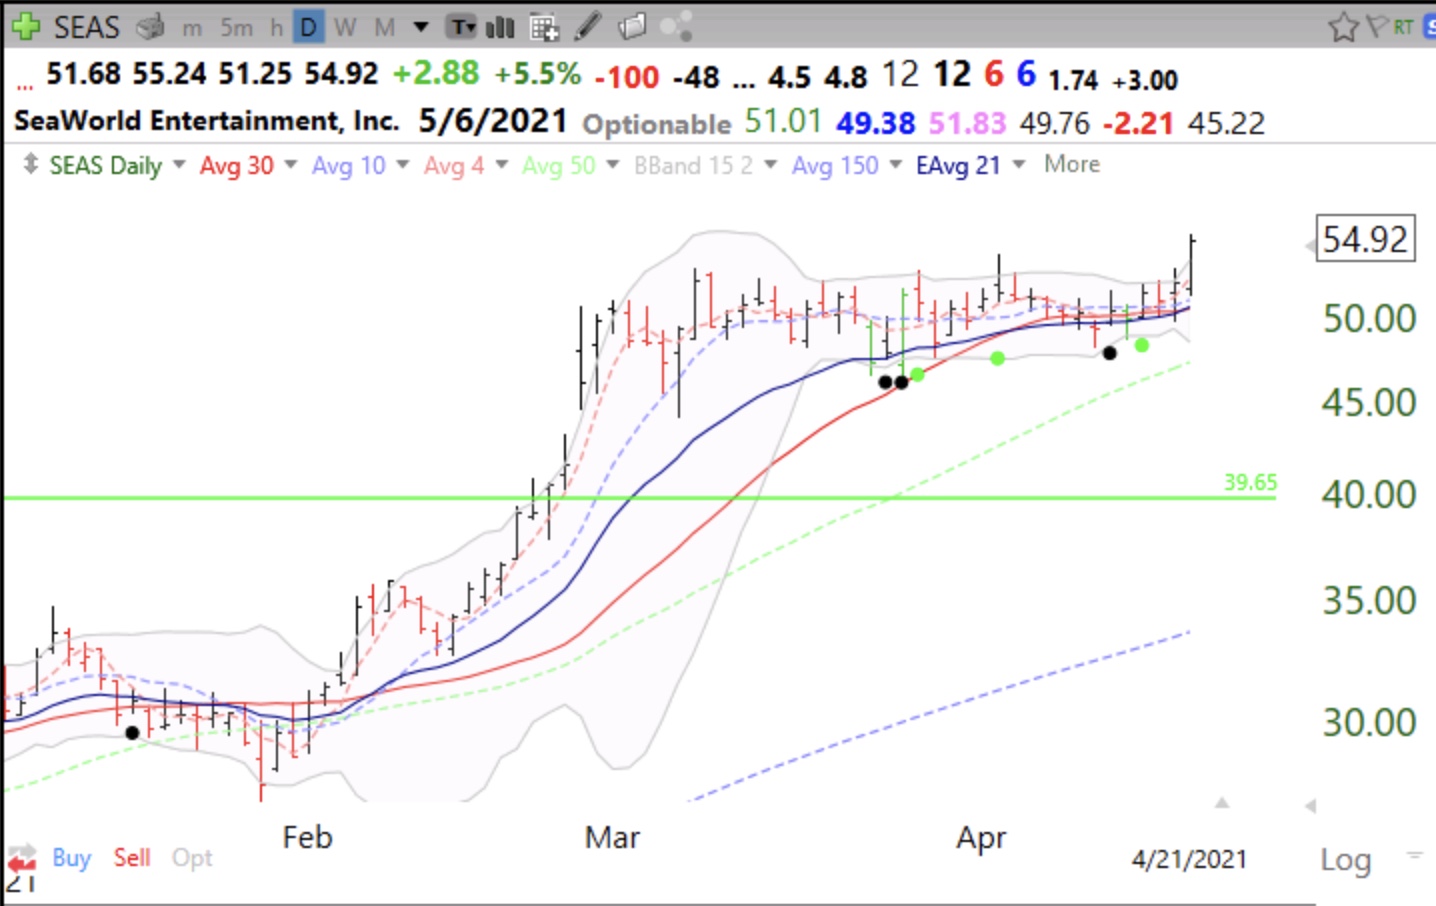
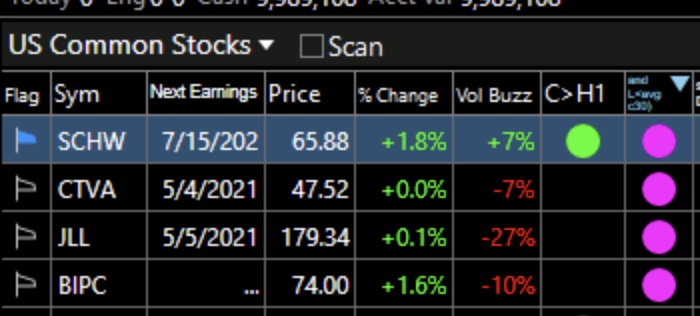
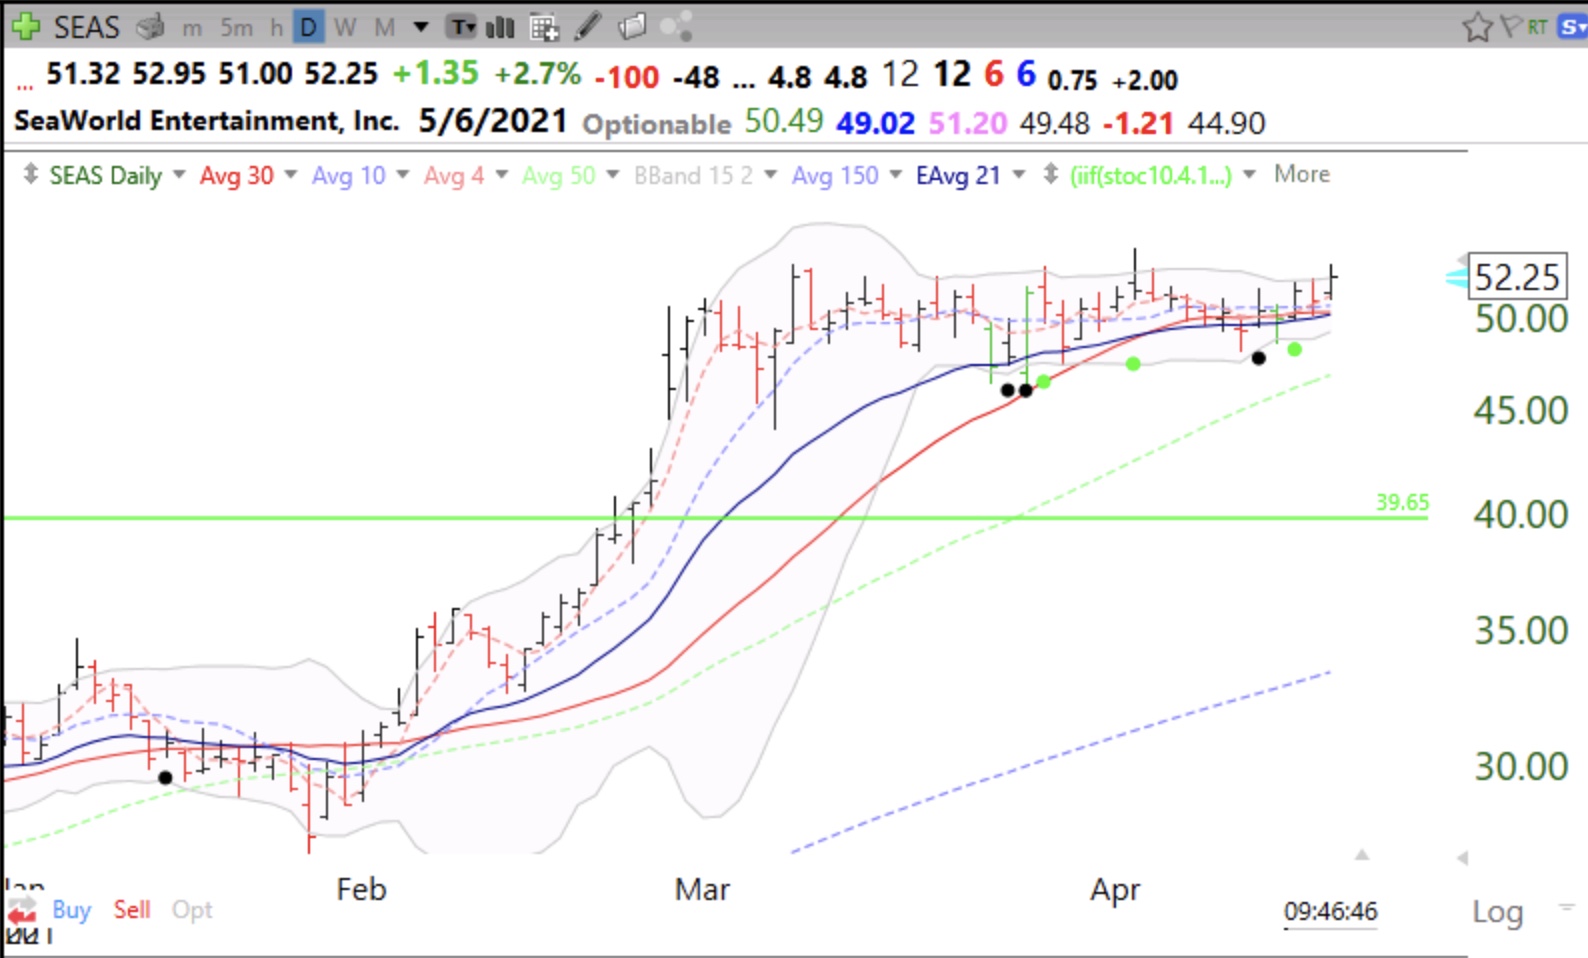
Weekly chart shows $QQQ approaching last ATH; 29th day of $QQQ short term up-trend, GMI back to 6 (of 6). Monday, May 18, 2020 @ 8:30 pm by Dr. Wish GMI6/6 GMI-25/9 T210875%
Blog post: $GLD moving up out of base again, see daily RWB chart. GMI remains Green, at 4 (out of 6), 28th day of $QQQ short term up-trend Monday, May 18, 2020 @ 6:30 am by Dr. Wish GMI4/6 GMI-24/9 T210857% Dotted line is daily closing price and is now above all 12 exponential moving averages and leading them higher. When all red lines are constricted it signifies little price movement — a short term base.
Weekly chart of recent GLB $LOGI shows huge volume up week; 27th day of $QQQ short term up-trend Friday, May 15, 2020 @ 7:32 am by Dr. Wish GMI4/6 GMI-23/9 T210855% Weekly chart: