Blog Post: Day 38 of $QQQ short term up-trend; Weekly 10:30 charts show $QQQ and $SPY in a solid up-trends

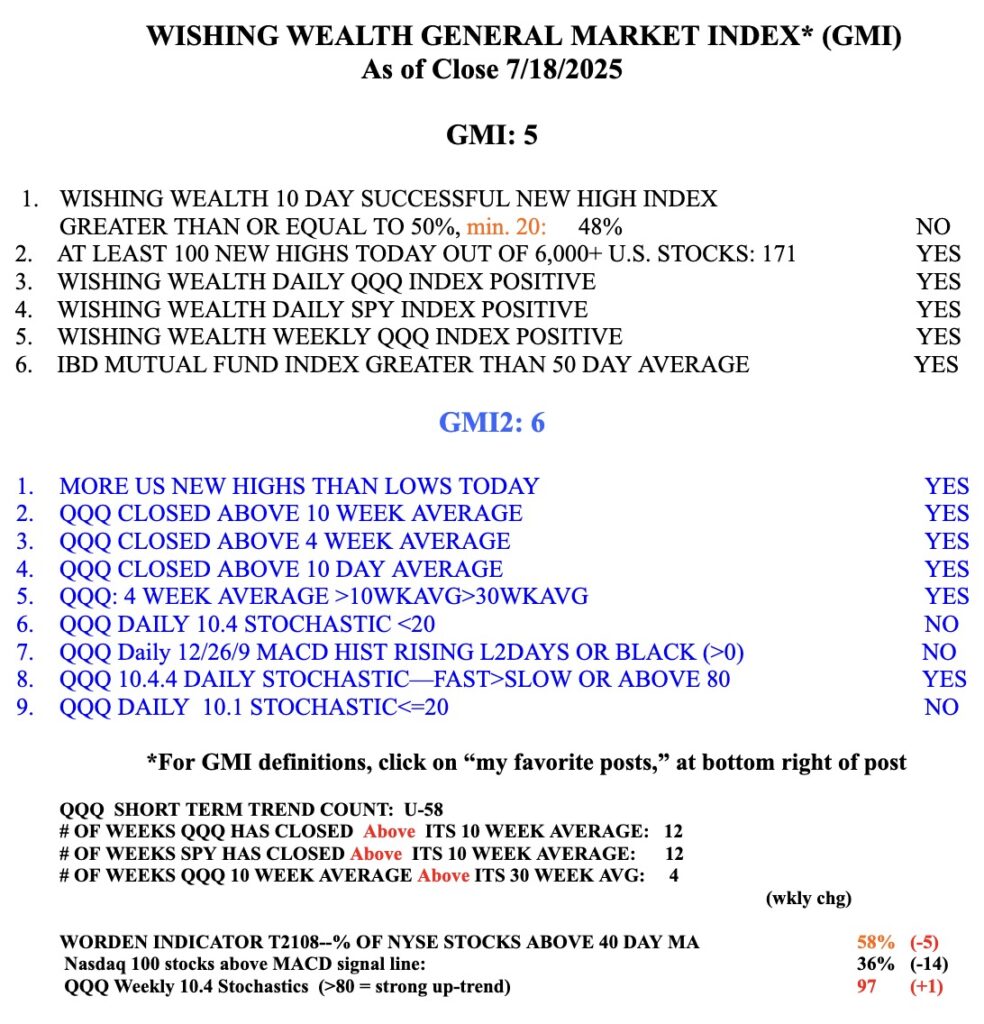
GMI5/6
GMI-24/9
T210836%

So many pundits claim that the markets are due for a decline. Instead of predicting Mr. Market, we would do better to just react to what he is doing. These 10:30 weekly charts look strong to me. The gray line is the weekly close and the dotted line is the 10 week moving average. The solid red line is the critical 30 week moving average of weekly closes. Compare the 2022 decline to the present trend. What do you see? Both the charts of $QQQ and $SPY tell me the same story. There is plenty of time to exit when the 10 week closes repeatedly below the 30 week.

Screenshot
Screenshot

The GMI remains Green at 5 (of 6).


Screenshot

Blog Post: Day 34 of $QQQ short term up-trend; Nasdaq100 stocks faltering; but $VITL had an IPO GLB on Monday, see daily and monthly charts and let’s see if it holds

GMI5/6
GMI-24/9
T210839%

You saw the recent GLB for ARM failed. In a weak market even the best set-ups often fail. That is why one always needs to have strict rules for minimizing losses. For example, if a GLB stock closes back below its green line I sell immediately.  VITL has good IBD fundamentals (Comp=99), but can it hold its green line at 43.30? I would have liked to see more trading volume on Monday. Stay tuned….

Screenshot
Screenshot