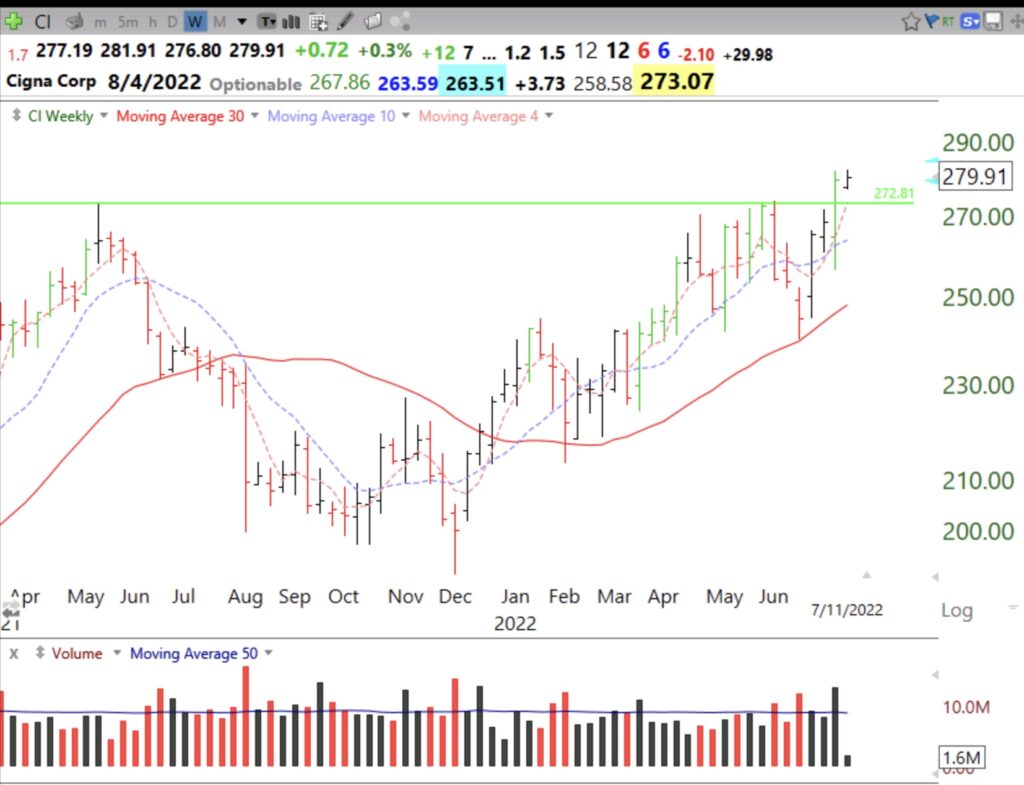
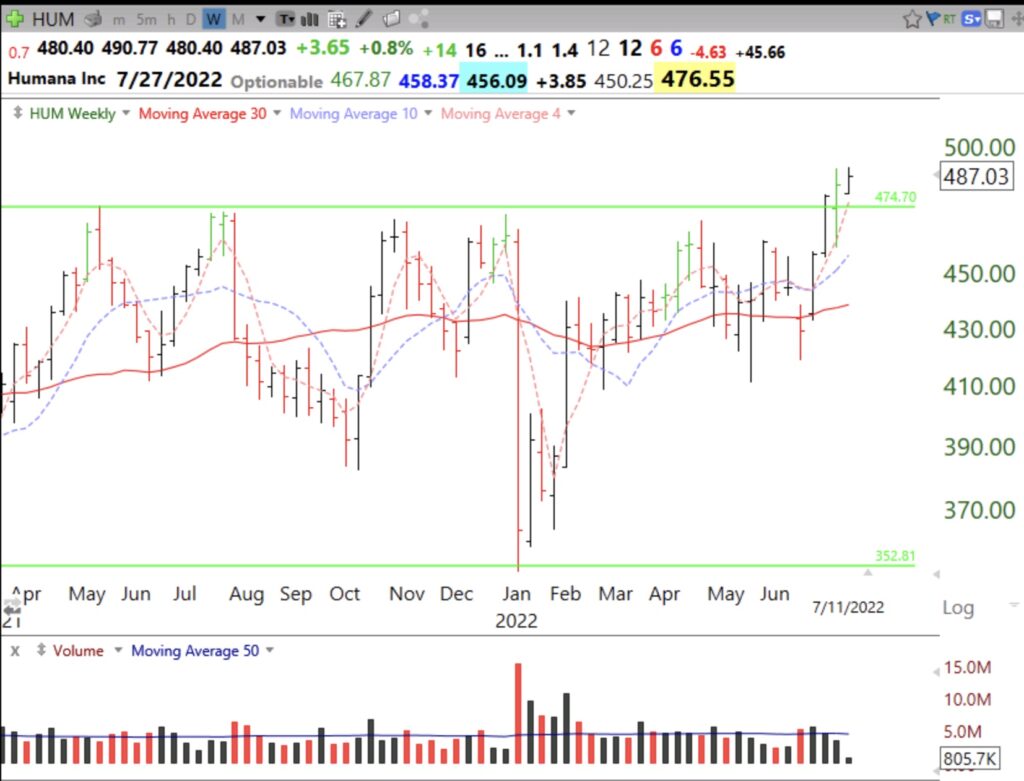
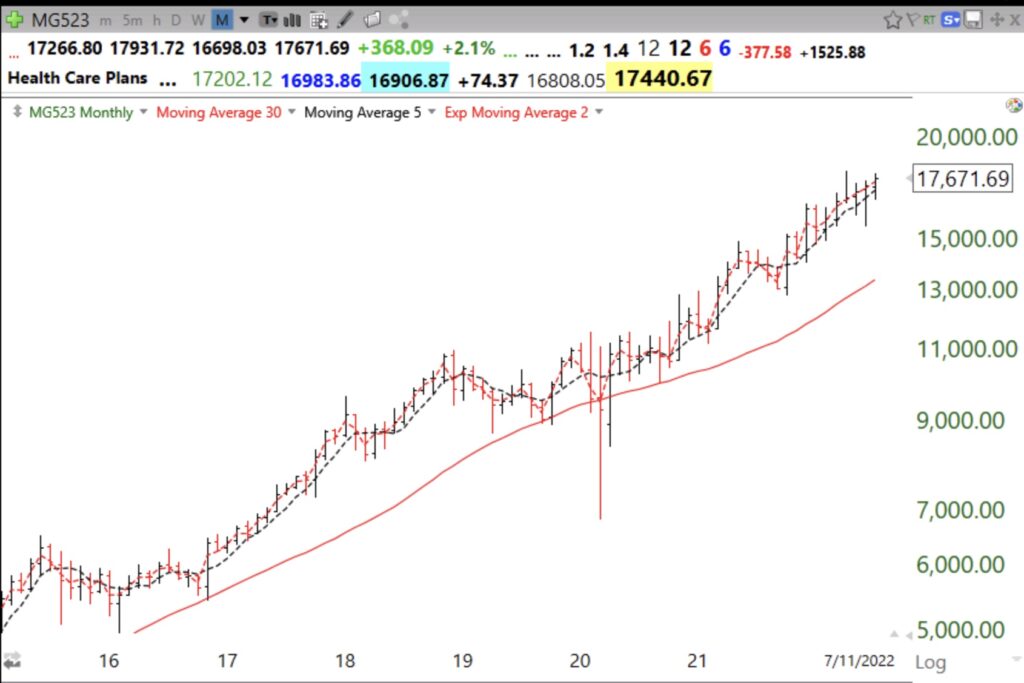
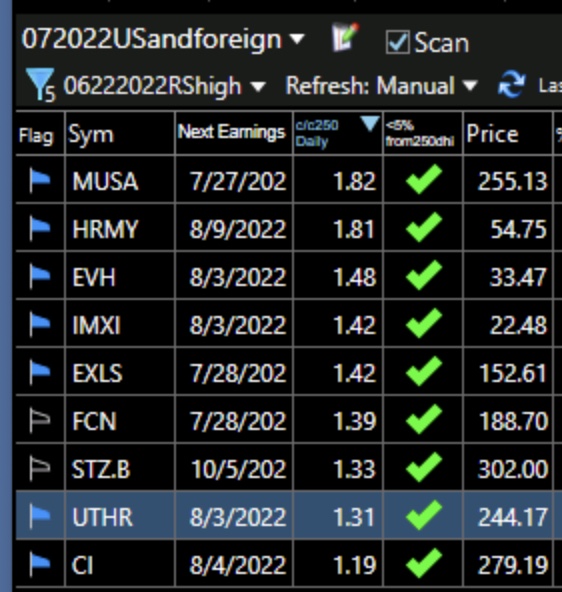
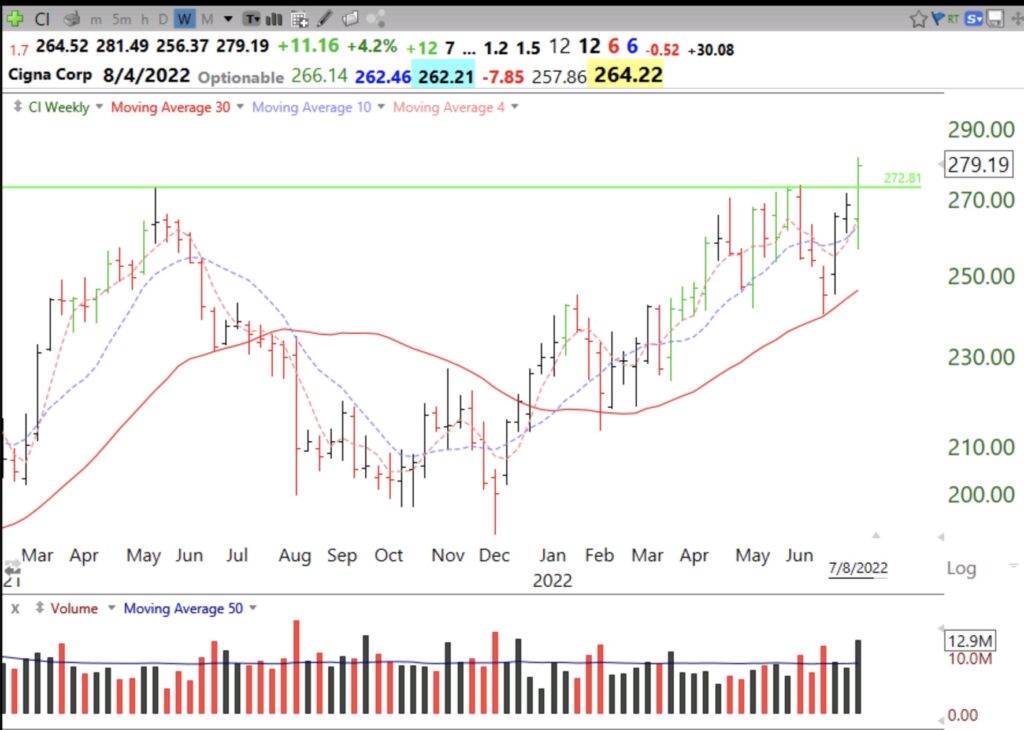
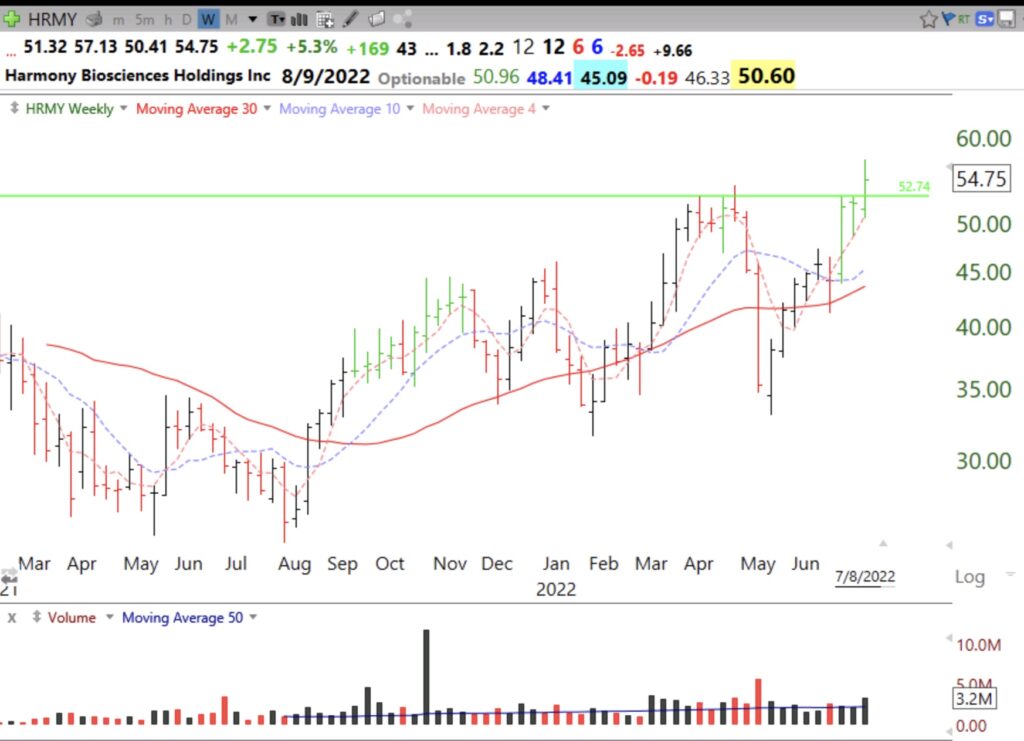
Stocks near all-time highs (ATHs) with RS at 50 week highs are worth monitoring. All but 2 have a flag indicating they are in my watchlist of stocks recently on IBD and MS lists. They are sorted by current price divided by price 250 days ago. CI and HRMY had GLBs on above average weekly volume, see weekly charts.
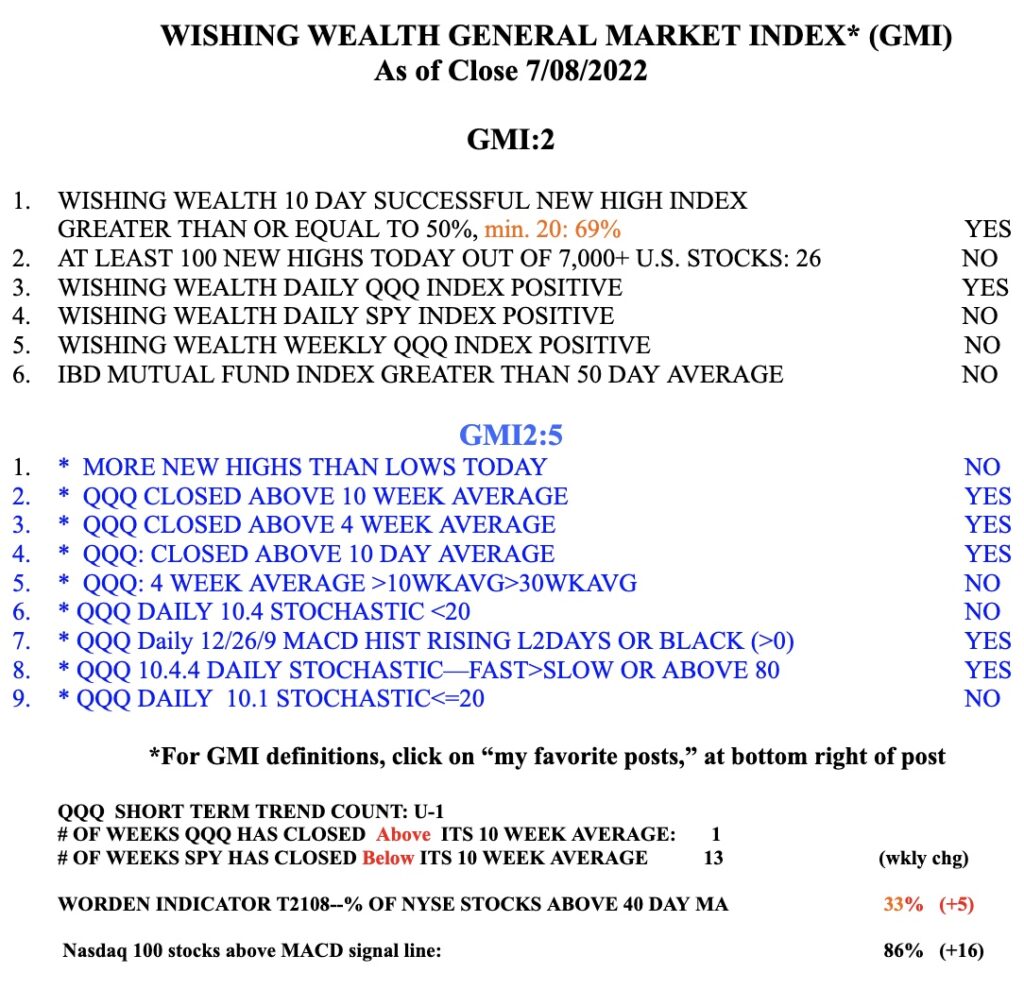
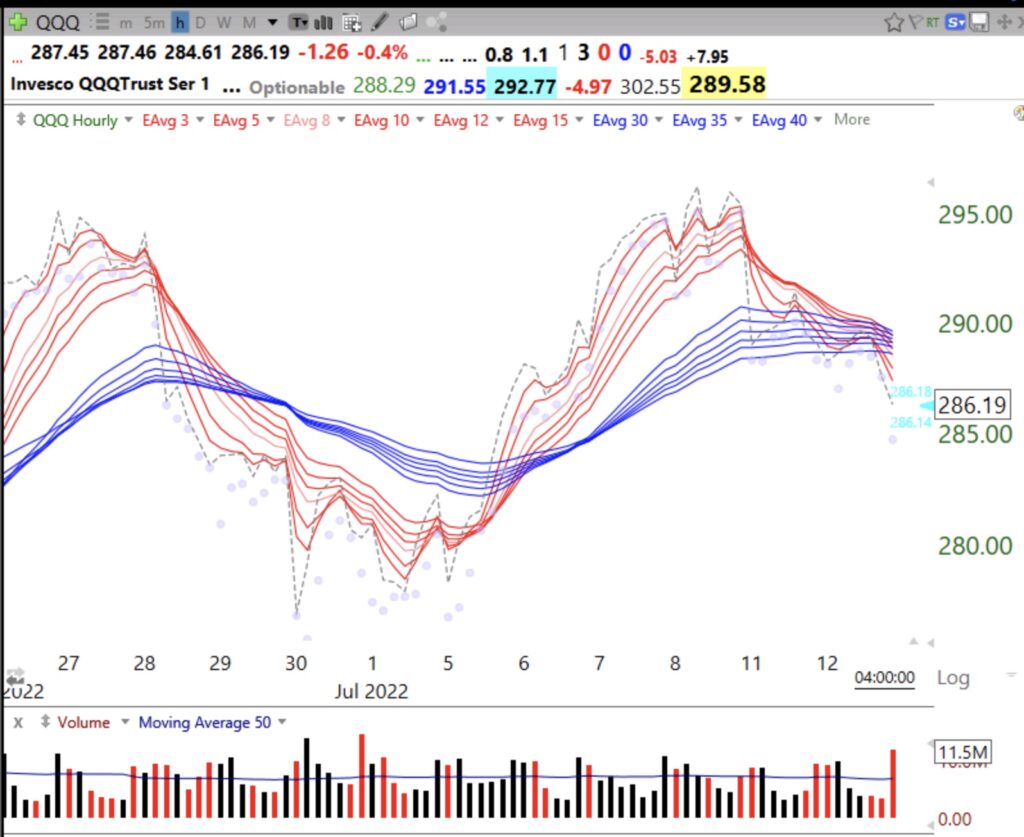
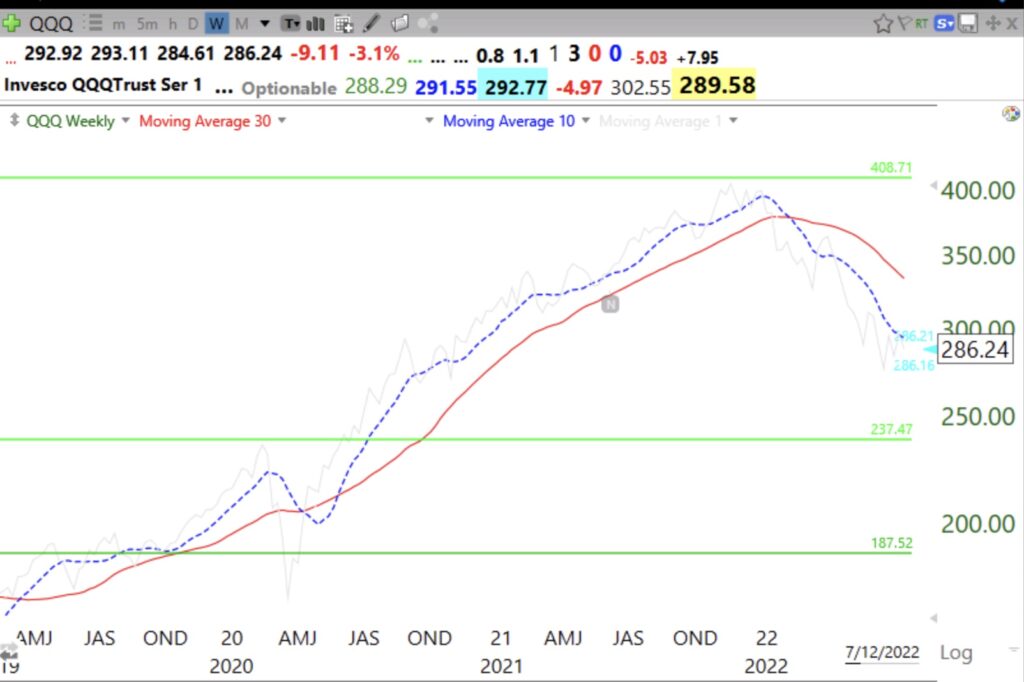
My QQQ short term indicator has turned up, U-1. As the GMI table shows, however, the longer term trend remains down. Still, all long term up-trends come after the short term trend turns up. I do not know how long this short term up-trend will last. Nobody knows. I am more confident if it reaches 5 days. Still, I will nibble at TQQQ and sell immediately if the up-trend ends. I will be presenting next Saturday afternoon at the 2nd Annual TraderLion conference. Check out Day 2 at their youtube site.
