Blog post: How I use Bollinger Bands to analyze QQQ — watch out for QQQ around 372; 12 of the 13 stocks from Sunday’s scan advanced; 5 new ones

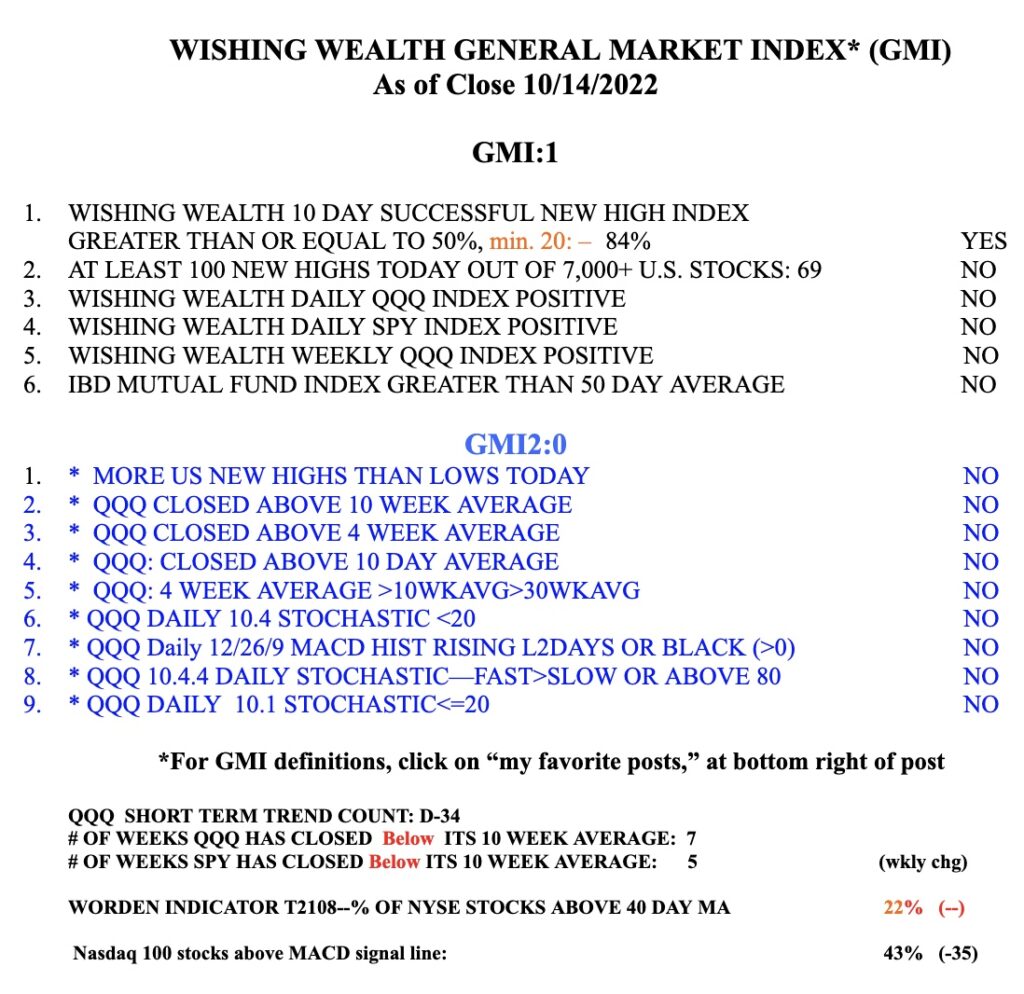
GMI0/6
GMI-23/9
T210833%

I have the 15.2 daily Bollinger Bands drawn on all of my daily charts. It is basically a confidence interval drawn 2 standard deviations above and below the 15 day moving average of price.  According to John Bollinger, about 90% of prices should remain within the 2 bands when he used a 20.2 setting. I use 15.2 as settings because they work for me. Many bounces occur off of the lower band and sometimes a rise will stop or hesitate near the upper band. On January 24 when the recent decline ended, and at three prior times (designated by green price bars) note that the price bar was way below the lower band and then closed back above it. I call this a Bollinger Band bounce.

In addition, the Bollinger Bands are now forming a pinch with each band moving towards the other one. A pinch usually leads to a big move up or down. One does not know in advance which way the stock or index will break. So we wait. I placed an arrow on this chart at 372, right where the upper band is now. The upper band is also up against the critical 30 day moving average. We need to see if QQQ stops at the upper band and begins to decline or  breaks out, causing the upper band to rise. Or will the pinch continue developing?  I find daily 2.15 Bollinger Bands to be very helpful for timing buys and sells. Find more details on them here.

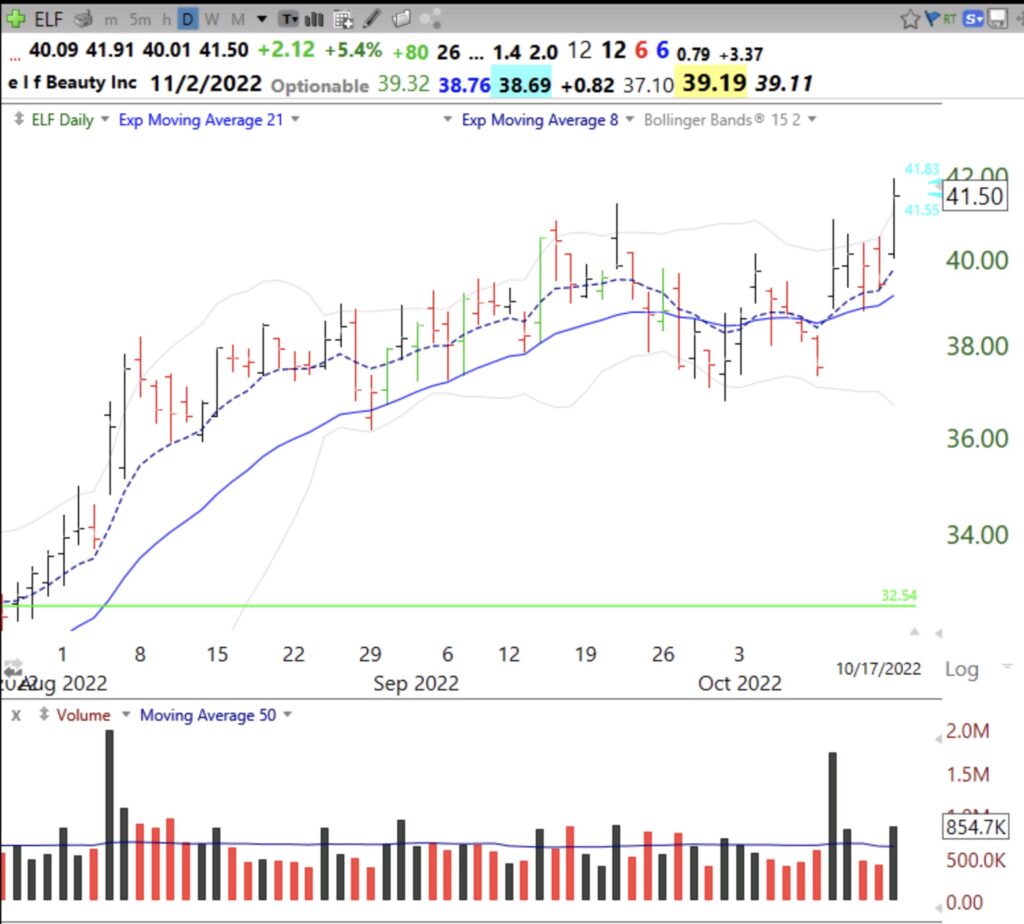
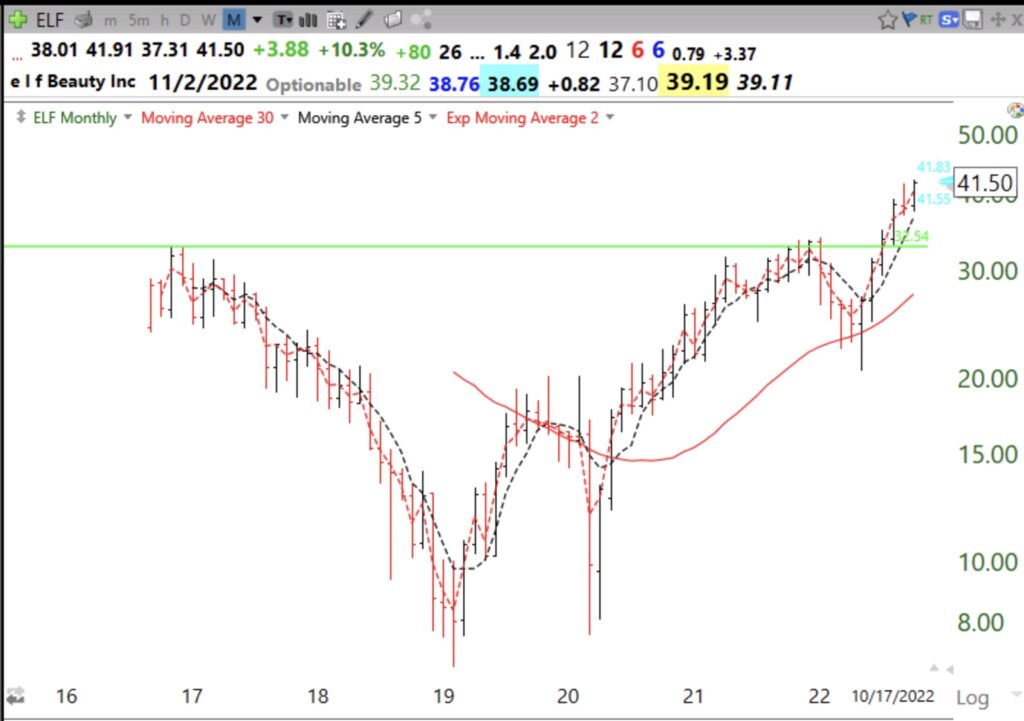
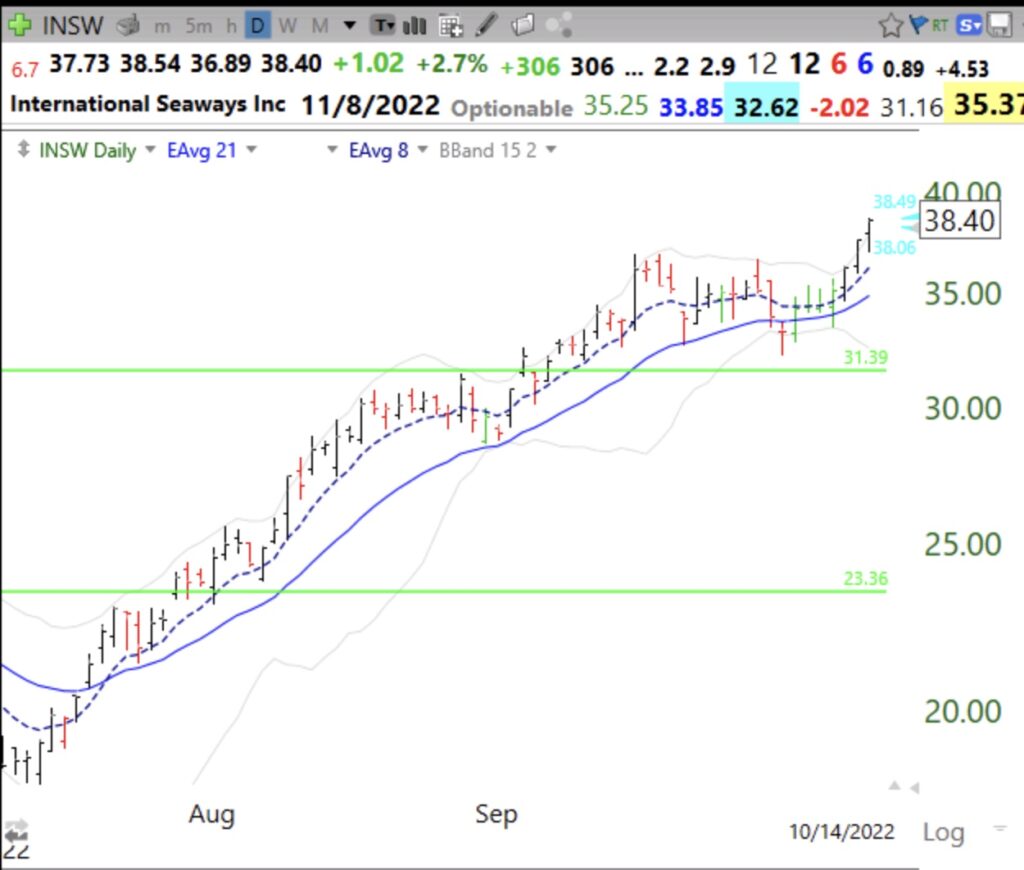
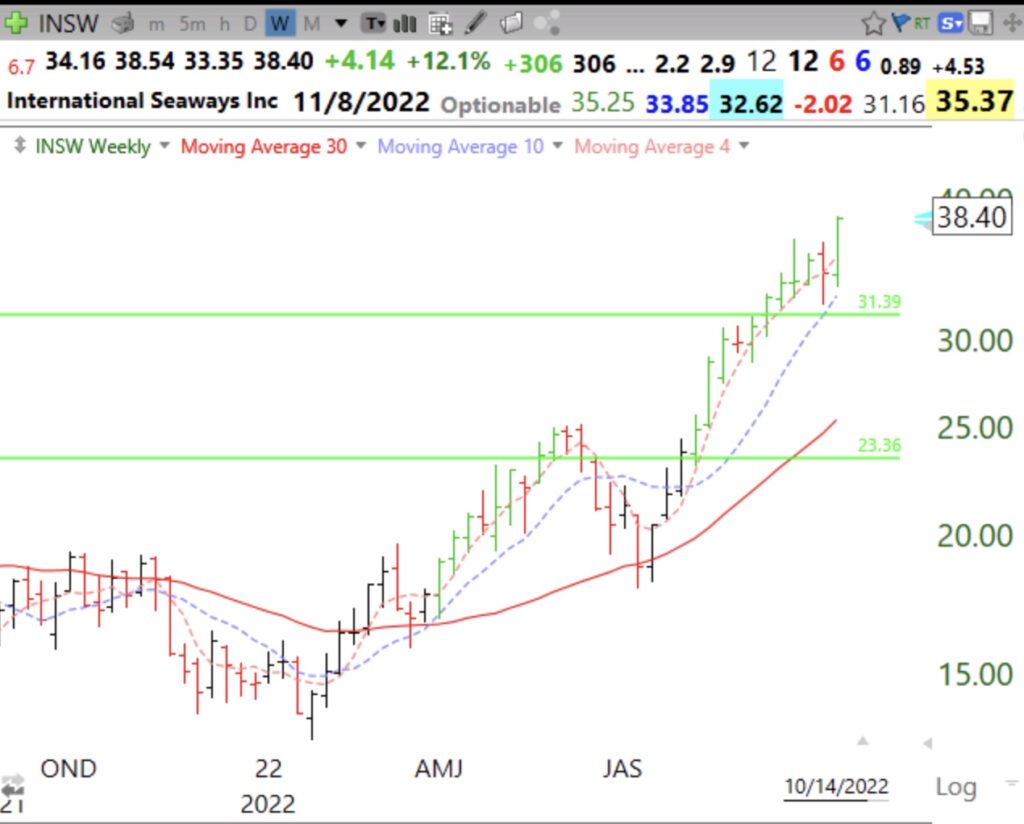
By the way, last Sunday night I listed 13 promising stocks from my IBD/MS watchlist that reached an ATH (all-time-high) last week. All but one of them are higher today, some by a lot. Remember KO and HSY? Go back and check them out yourself.  Buying stocks at ATH is the way to go. I don’t buy stocks that are way down from their peaks until they break above their former peaks (GLB).  The same scan finds 6 companies tonight: HSY, MCK, ACGL, ECPG, ABC and MS. Whether these rise will likely depend on how QQQ resolves. Remember, these are for illustrative purposes, do not buy these stocks unless you research them and they meet your own setup criteria. It will be interesting to see if they do as well as Sunday’s list. The stock market is such an amazing intellectual puzzle…

Blog post: Scan found 13 out of 350 IBD/MS type stocks that reached ATH last week: $KO and $HSY, see list; Richard Moglen’s new interview with @PatrickWalker56 is terrific!

GMI0/6
GMI-23/9
T210826%

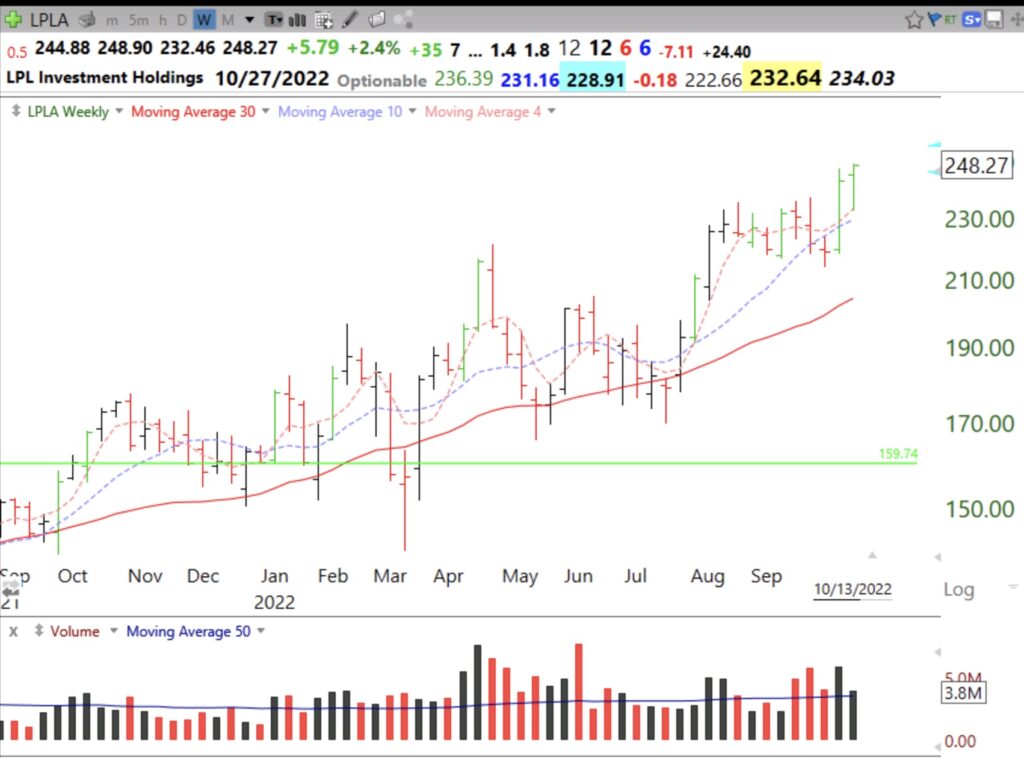
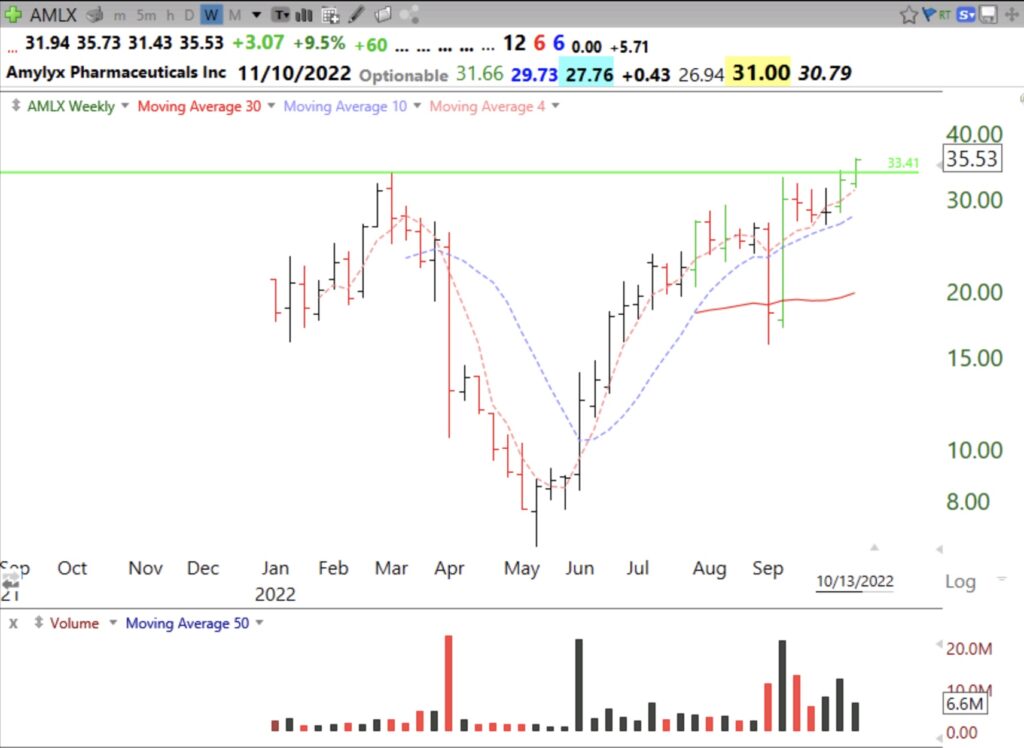
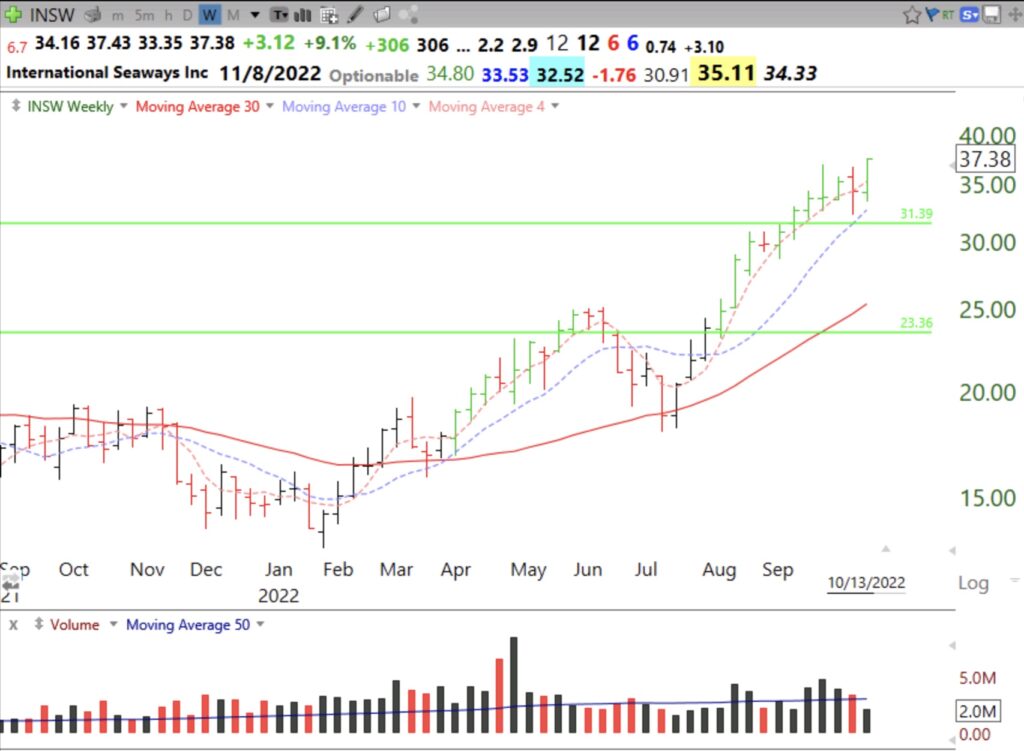
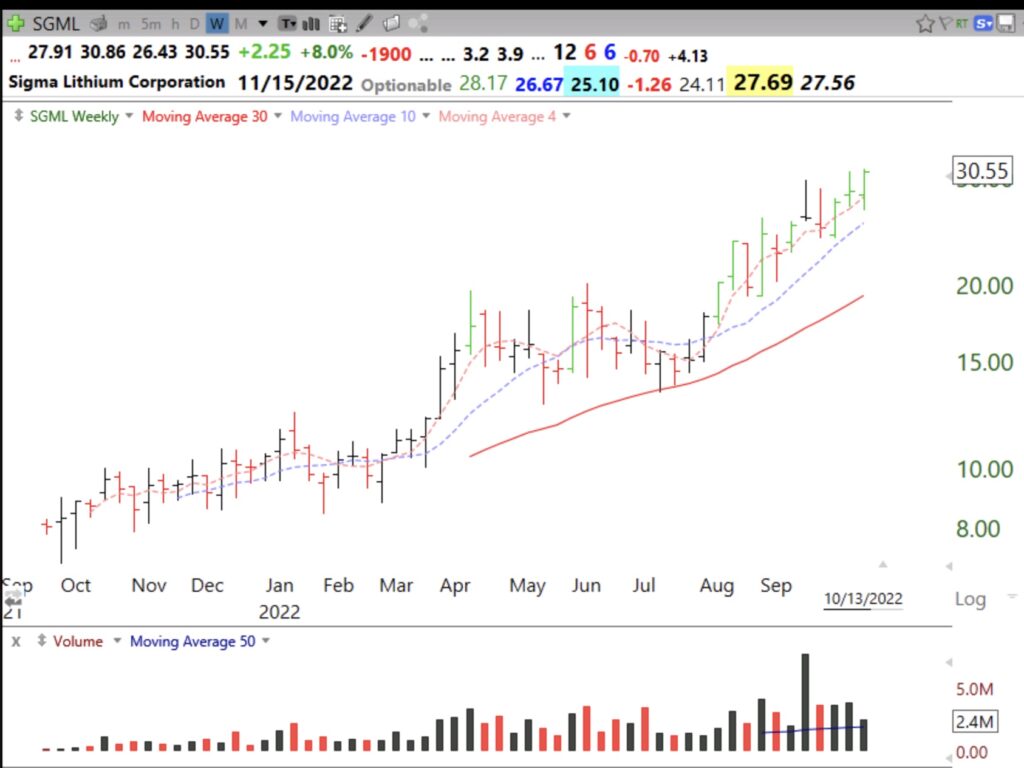
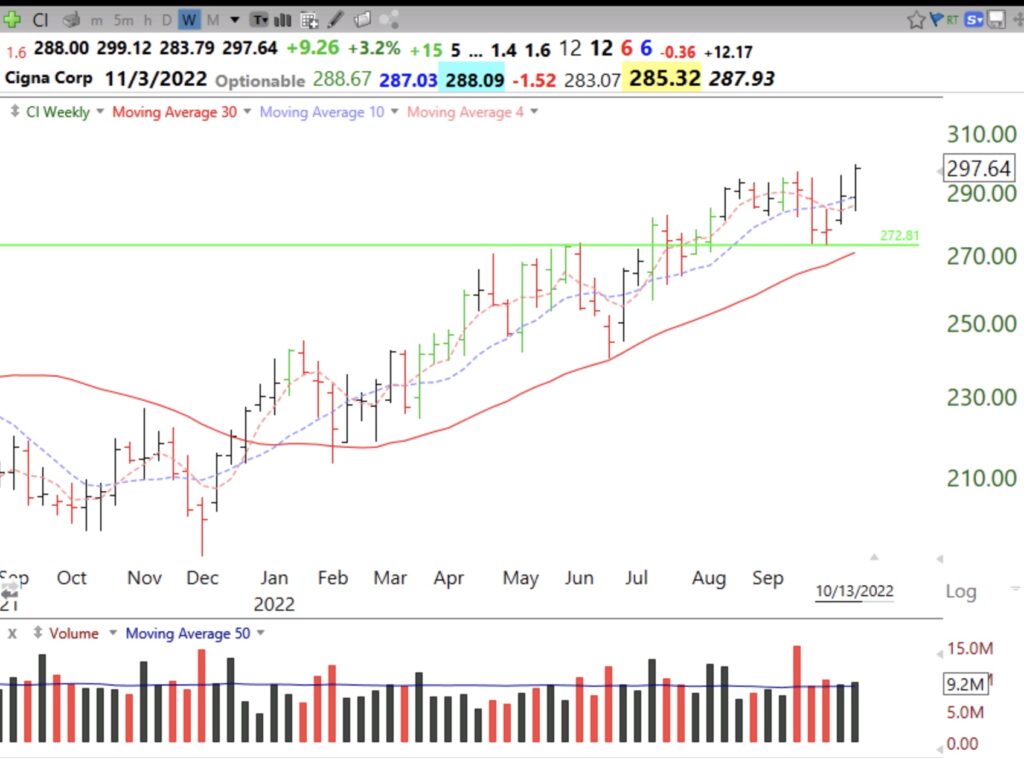
I ran my TC2000 scan of stocks on my IBD/MarketSmith watchlist of 350 stocks and it identified the 13 stocks below. These stocks all hit an all-time high last week, have strong weekly chart up-trends and bounced up above their 4 week averages. It is noteworthy that KO and HSY came up. I guess stock buyers think people will not give up buying chocolate and Coke during inflationary times. I am actually 100% in cash in my university pension and my trading accounts now. I am content  to wait on the sideline while Mr. Market reveals his next direction. All major indexes (DIA, SPY, QQQ, IWM)  closed the week below their key 30 week averages. Could they be beginning Stage  IV declines?

Below are the 13 stocks that my scan detected, ordered by next earnings date. I am not buying anything now and if I had, and any of these were to close below their 4 week averages or green line tops, I would exit immediately. Fun to just watch. By the way, my former extraordinary student, Richard Moglen, taped a second interview with Patrick Walker, who also lectured to my class last semester–it is well worth watching.

The GMI remains Red and =0, of 6.