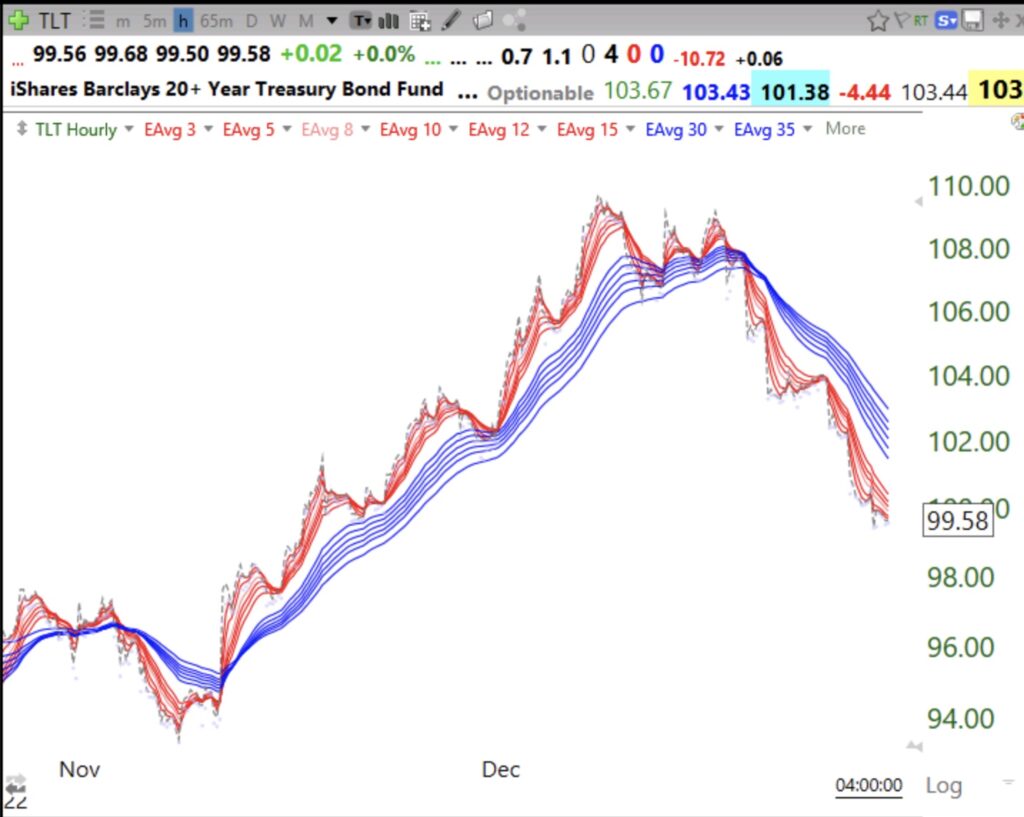
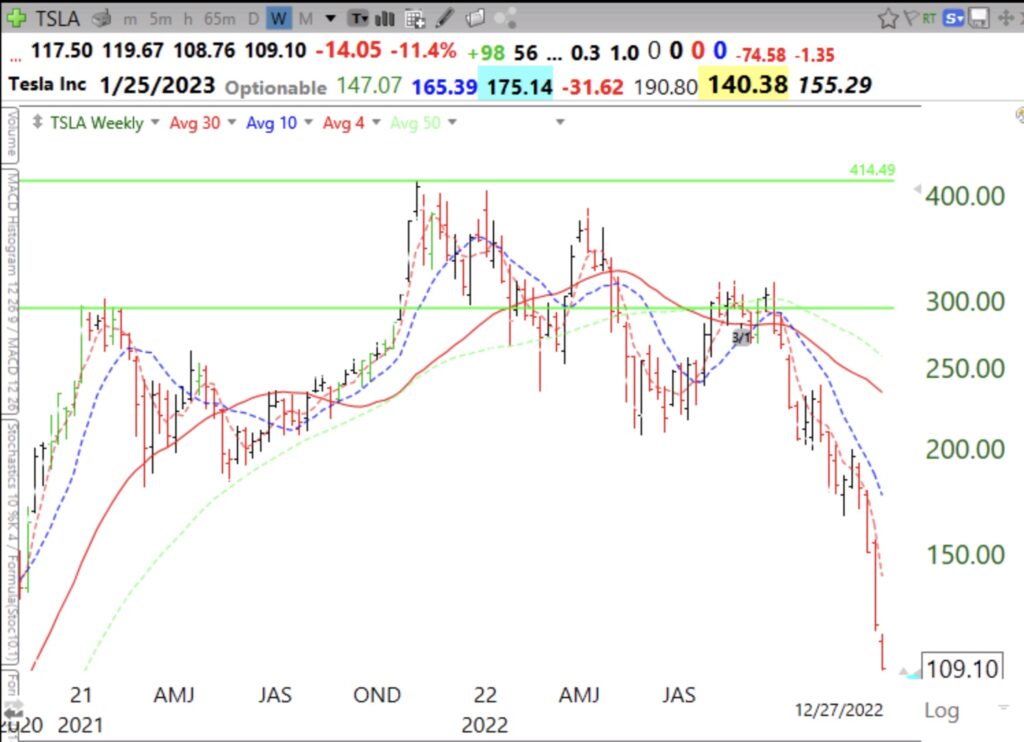
I have often taught that the same set-ups that work beautifully for me in a rising market can fail miserably in a declining market. Model books of rising stocks can be very misleading because, by definition, most set-ups worked for these winners. With these model stocks that rise for months one could just buy every Monday or every x day and make money. There is nothing special about the set-ups. The authors never tell you how often the highlighted set-ups can fail. Here is a fine example.
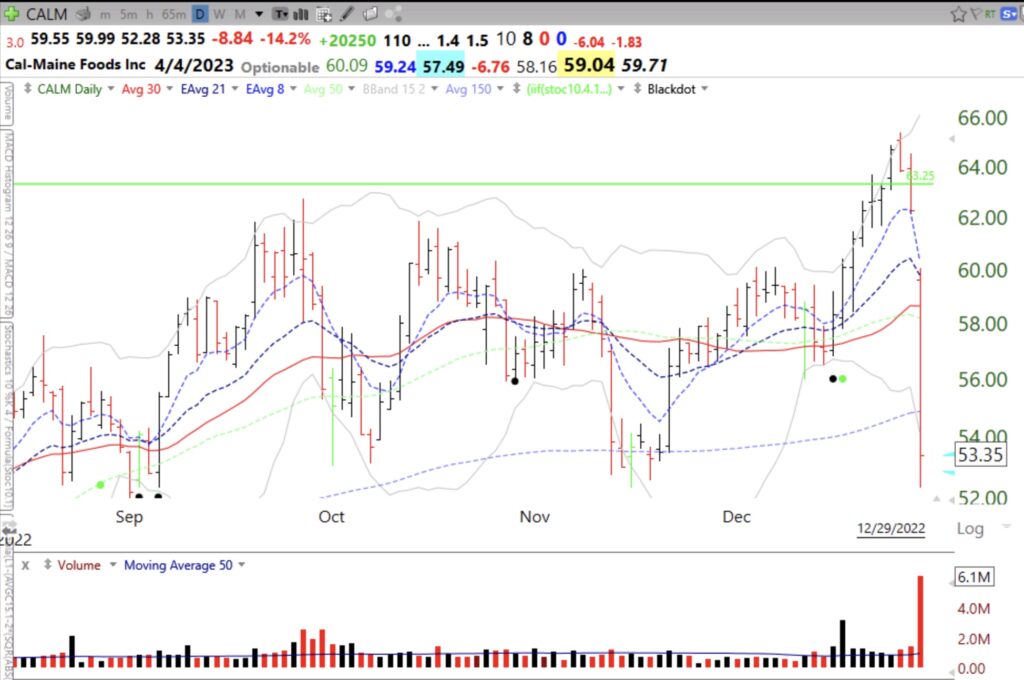
Last Friday I saw that CALM had a GLB (green line break-out) to an ATH. Its green line peak was established in October, 2015. CALM was one of just 5 stocks trading Friday at an ATH. CALM closed Friday near the day’s high. On Tuesday it traded above its upper 15.2 daily Bollinger Band and reversed to close down for the day. On Wednesday it closed back below its green line. And on Thursday, after an earnings miss, the stock closed down 14.5%. So how should one have played this GLB? First, one must sell immediately if a stock closes back below its green line. That is a failed break-out. Second, without a large gain to protect against a possible decline, one should never hold through earnings.
GLBs can be great set-ups. But during a declining market, one should be very cautious when buying stocks breaking out to ATHs. It takes an established advancing market for traders to feel confident to buy break-outs and to hold them for a sustained rise. NEVER fight the general market’s trend.


