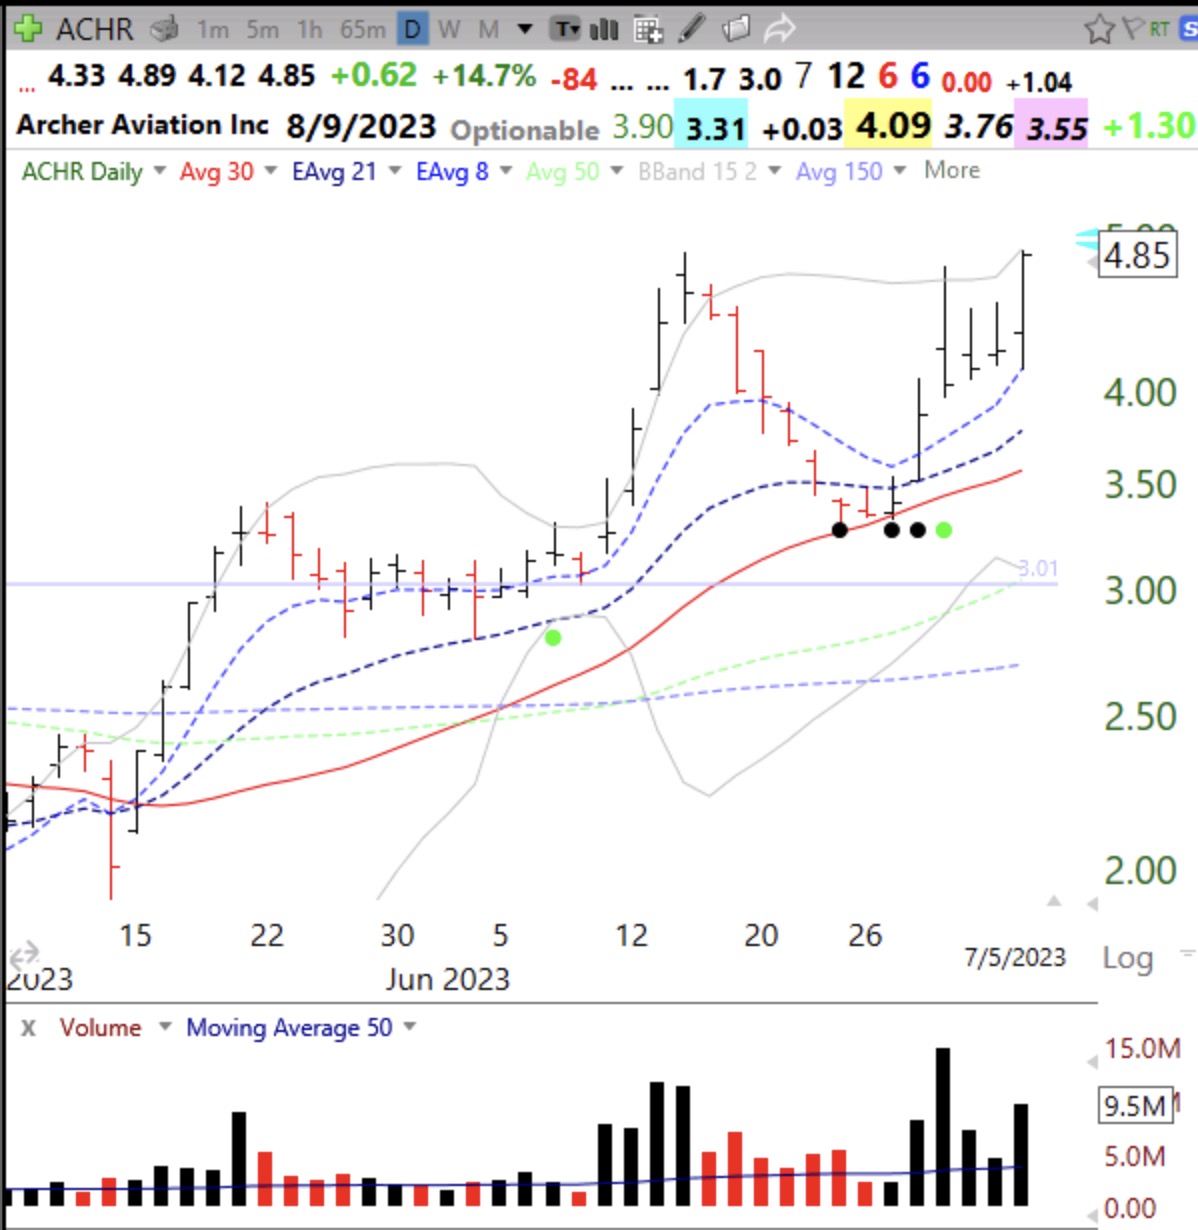
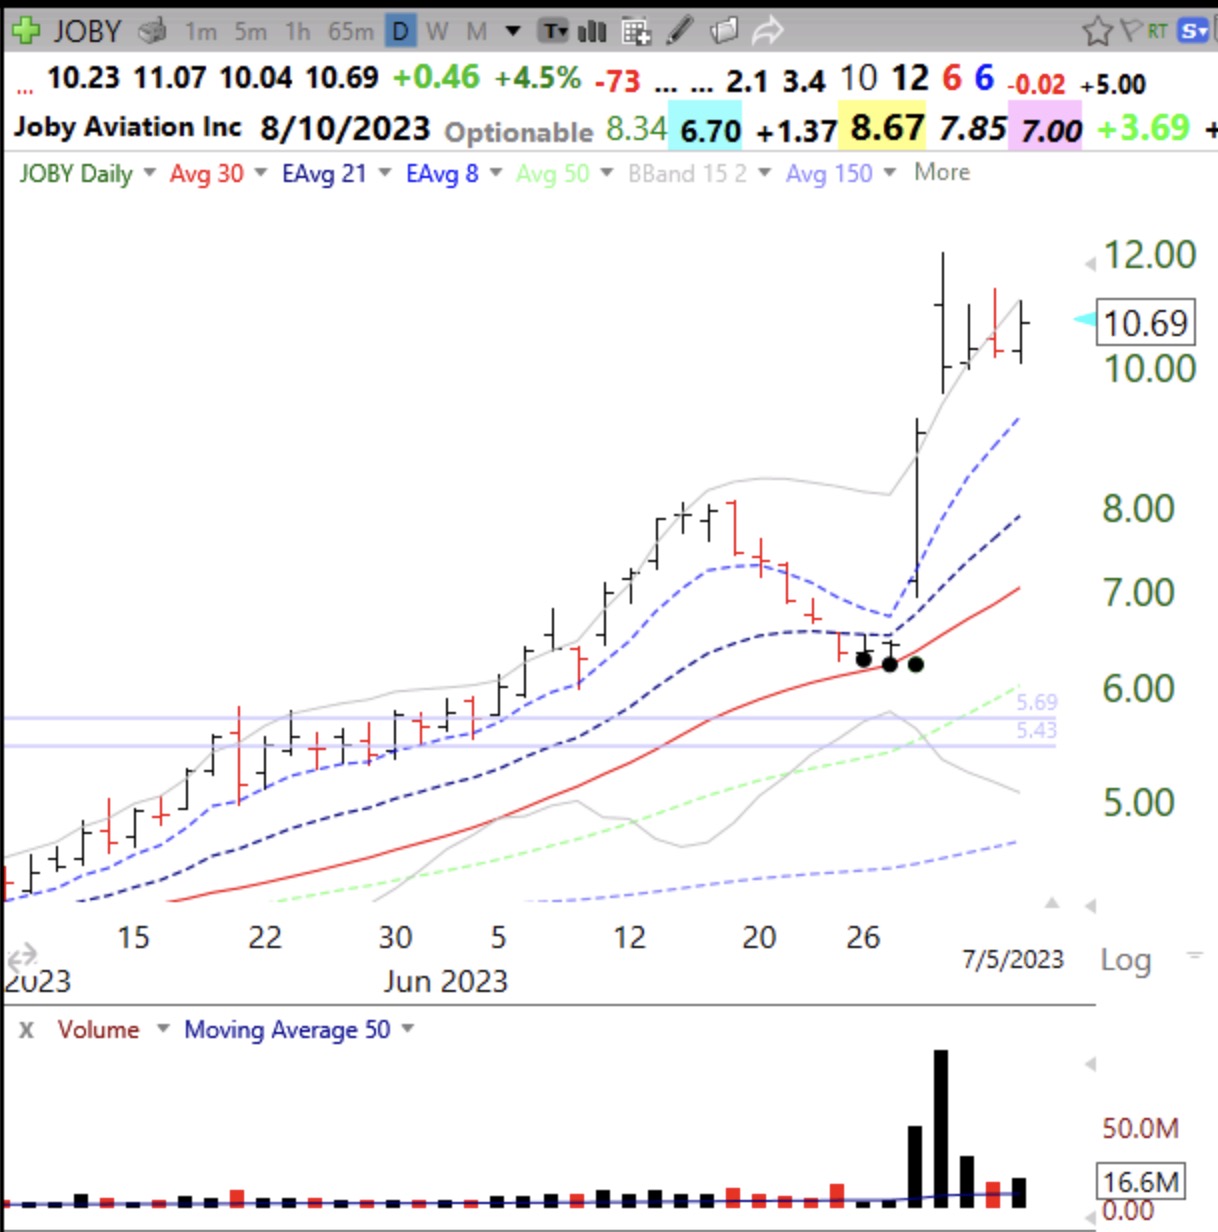
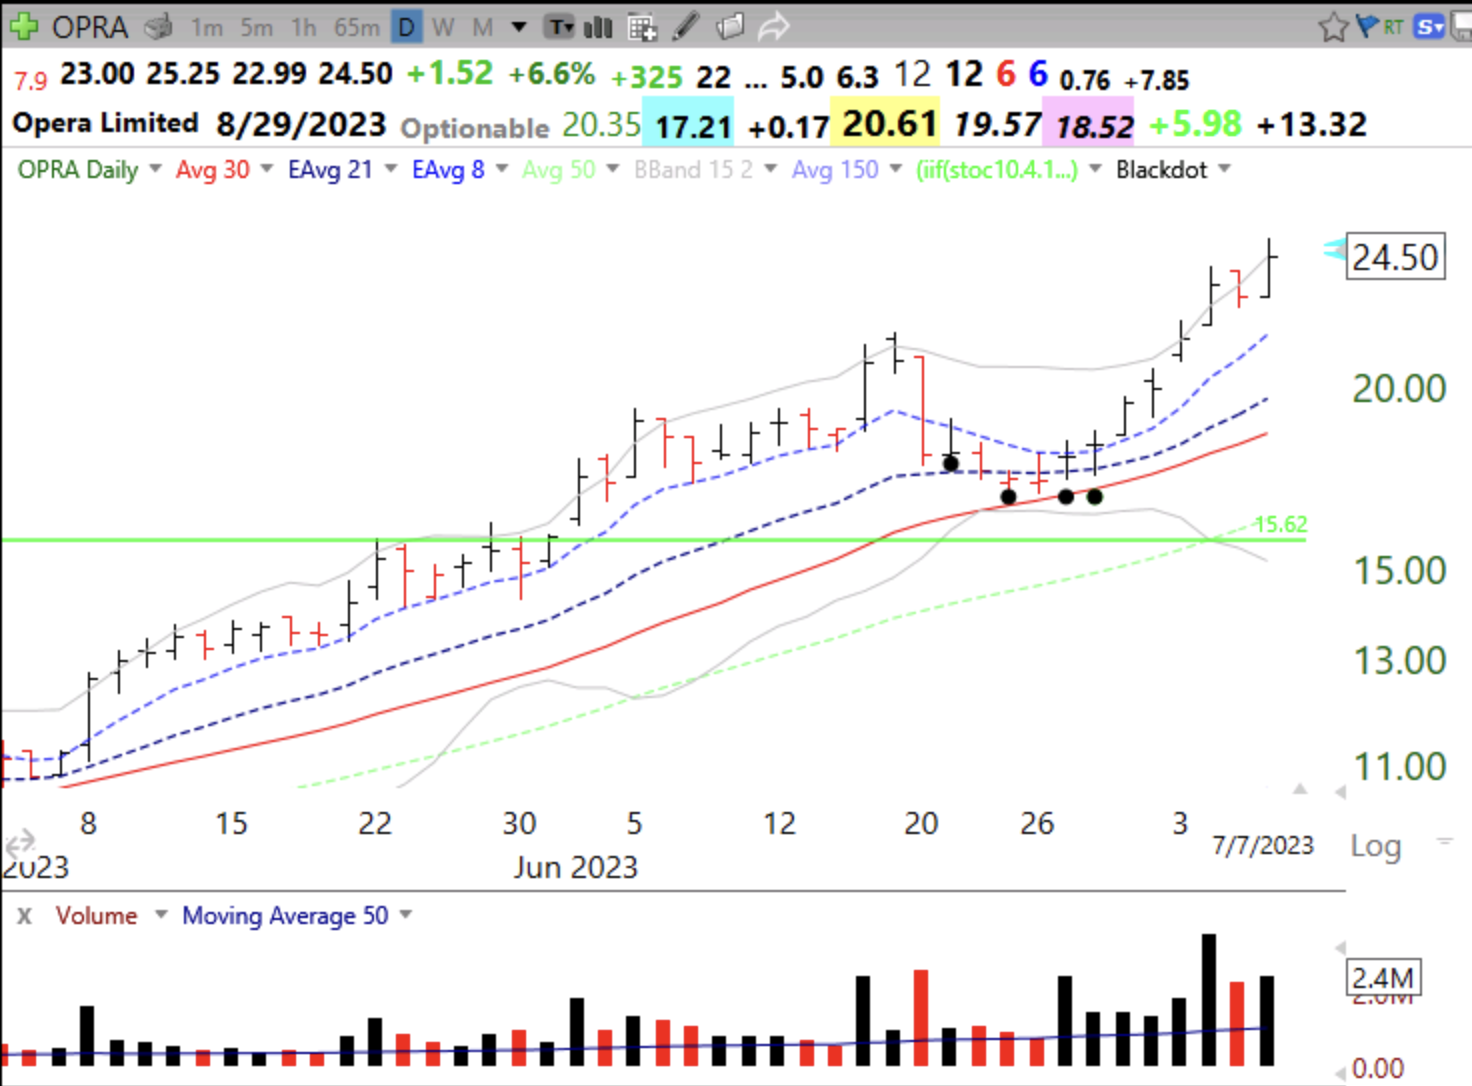
I have been refining my black dot oversold indicator by requiring a prior recent yearly high. I am looking for a stock that has been strong enough to reach a high and then becomes oversold and starts to move up. The beauty of such a set-up is that I can place my stop loss below the low of the bounce day. If the bounce fails I am sold out with a small loss. OPRA kept showing up on my all-time high scans and then had the OSB, designated by the black dots. OPRA has an IBD composite rating=99, RS=97 and ACC/DIS=A+. Earnings are expected to rise +96% this year. It is involved with AI and has already advanced 6x its year’s low price. I missed this bounce and do not own it. It is above its last green line top.
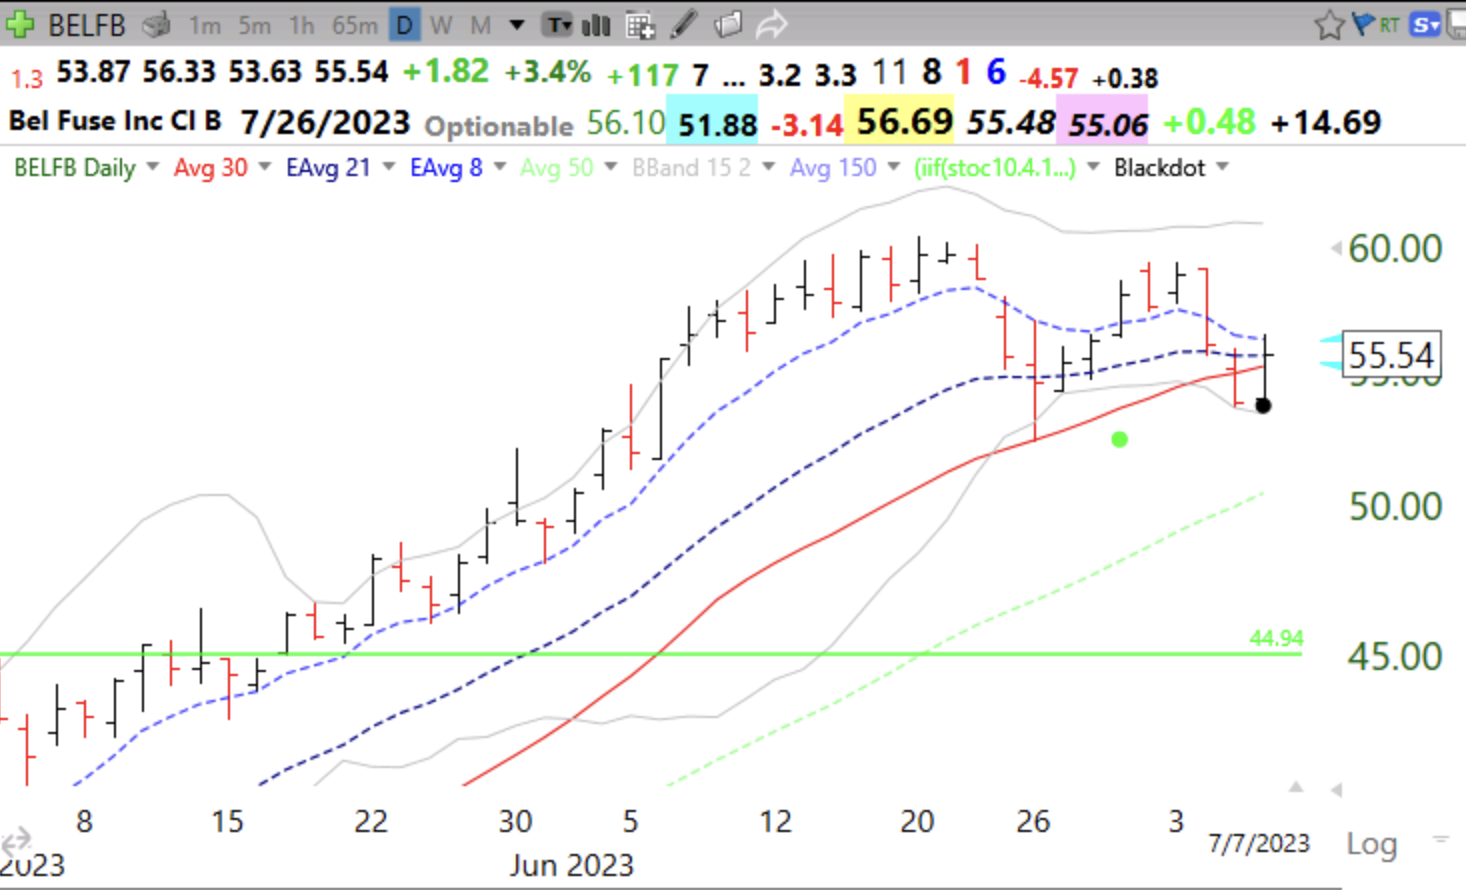
BELFB triggered this set-up on Friday and I bought a little. Let’s see of it holds on Monday. Note it is also above its last green lie top.
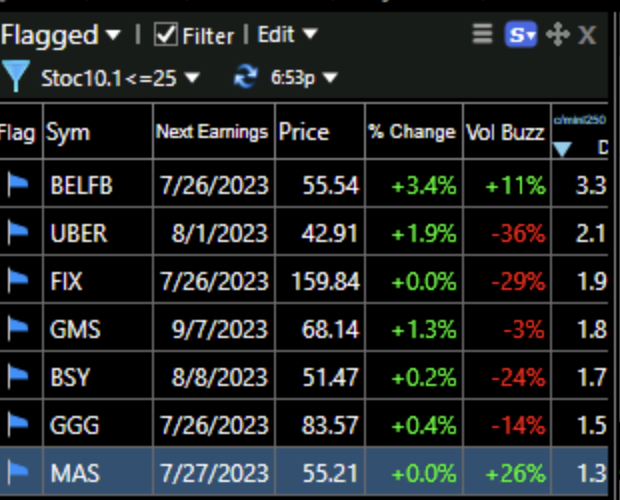
Other growth stocks meeting this set-up on Friday appear below. They are sorted by the last column, which is close/minimum price last 250 days. BELFB is 3.3x its low.
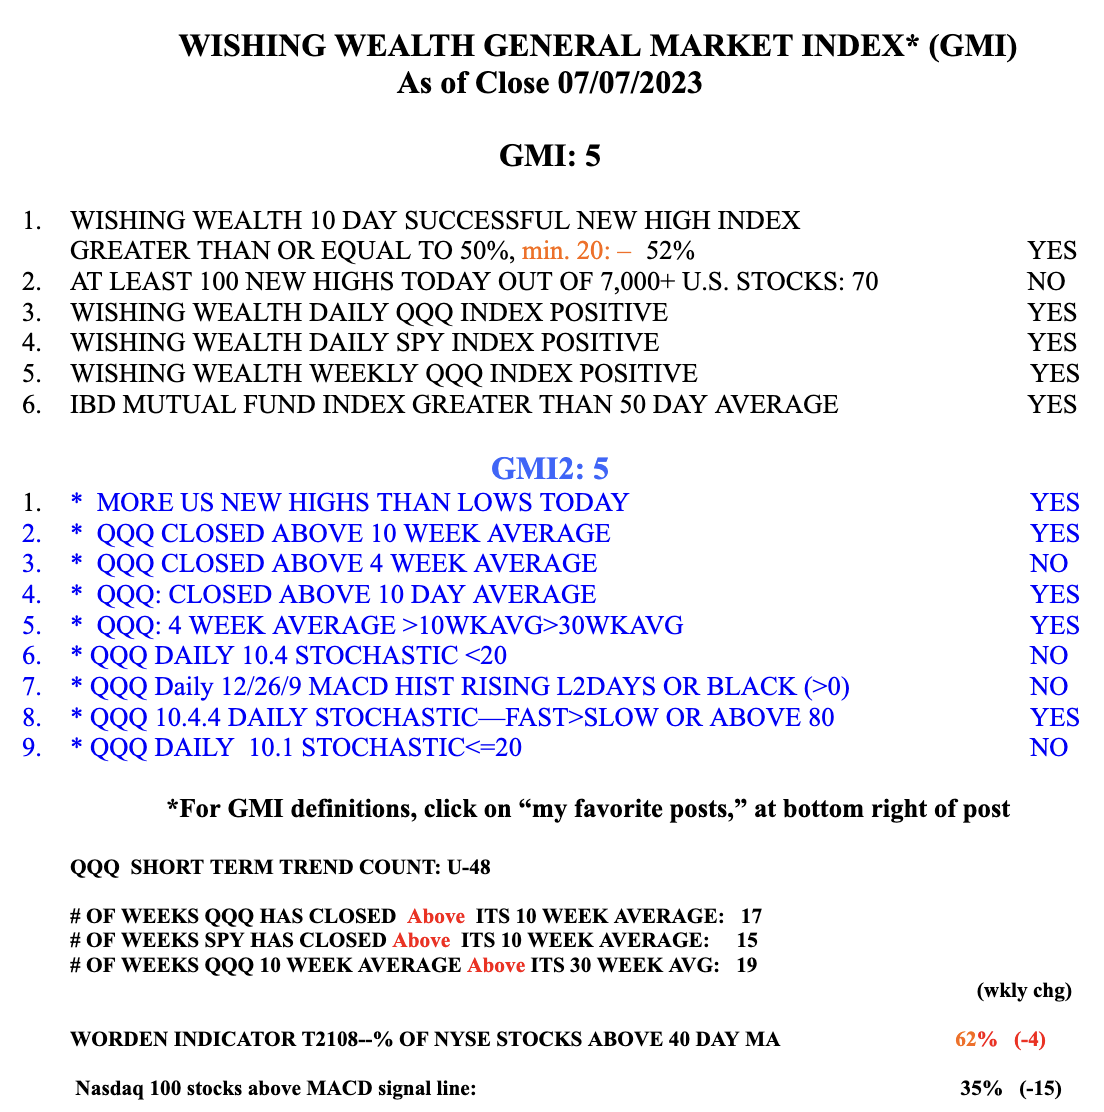
The GIM remains Green.