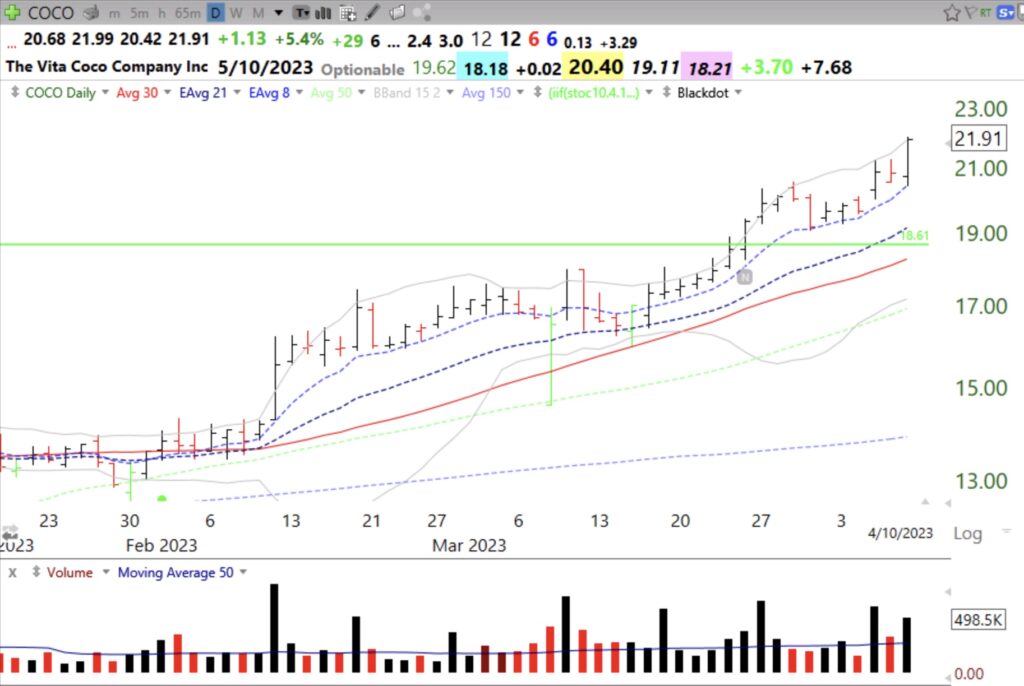
COCO had a GLB on 3/24 and the volume shows spikes of buying since February. MarketSmith says COCO has a Comp Rating=94 and AccDis Rating =A+. RS=99. I like the fact that COCO is now 3x its lowest price the past year. And 2023 earnings are projected to rise +371%. Here are the daily, monthly and weekly charts. I have a small position in COCO. COCO is right up against its 15.2 upper Bollinger band and may be extended now. It finds support at its 8 EMA, the upper dotted line.
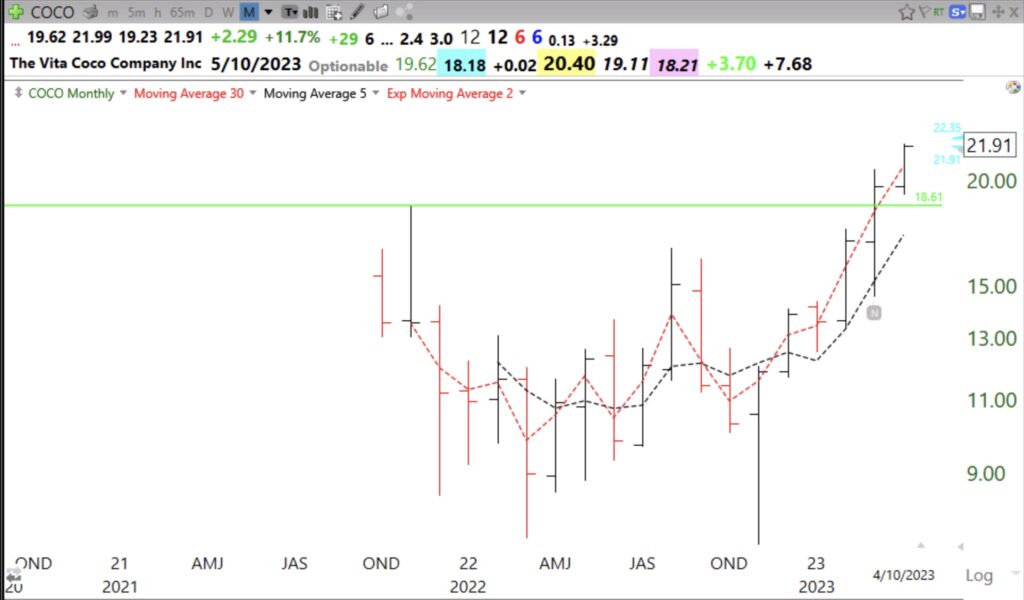
The monthly chart shows COCO to have an IPO break-out pattern.
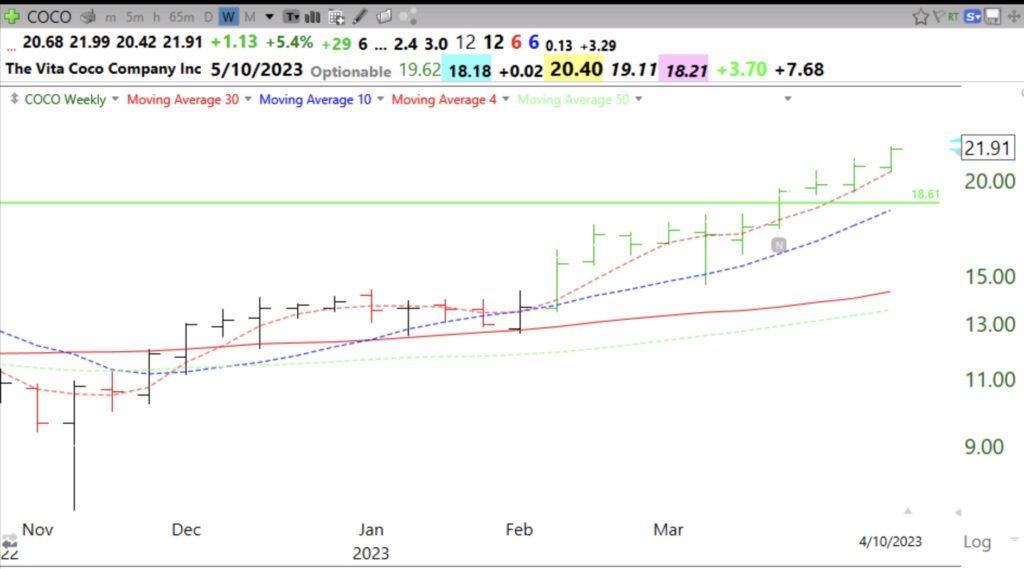
This weekly chart shows COCO riding its 4 wk avg, the red dotted line.
