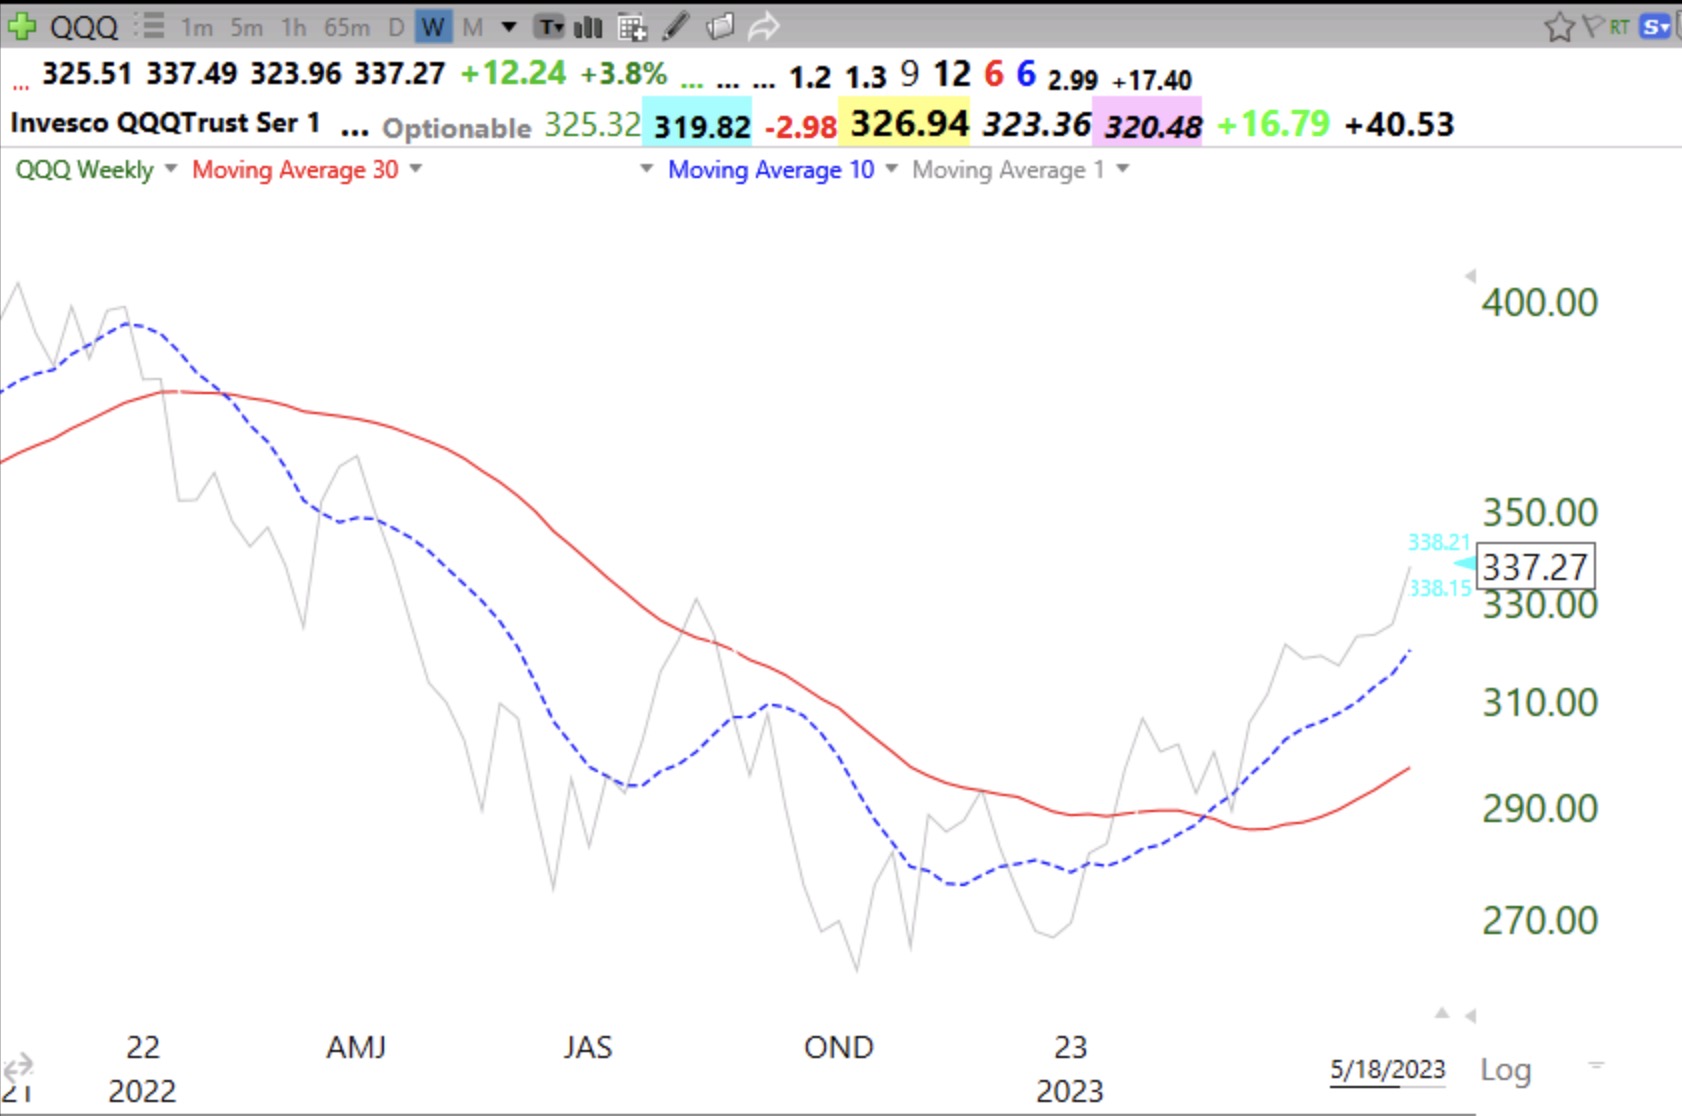
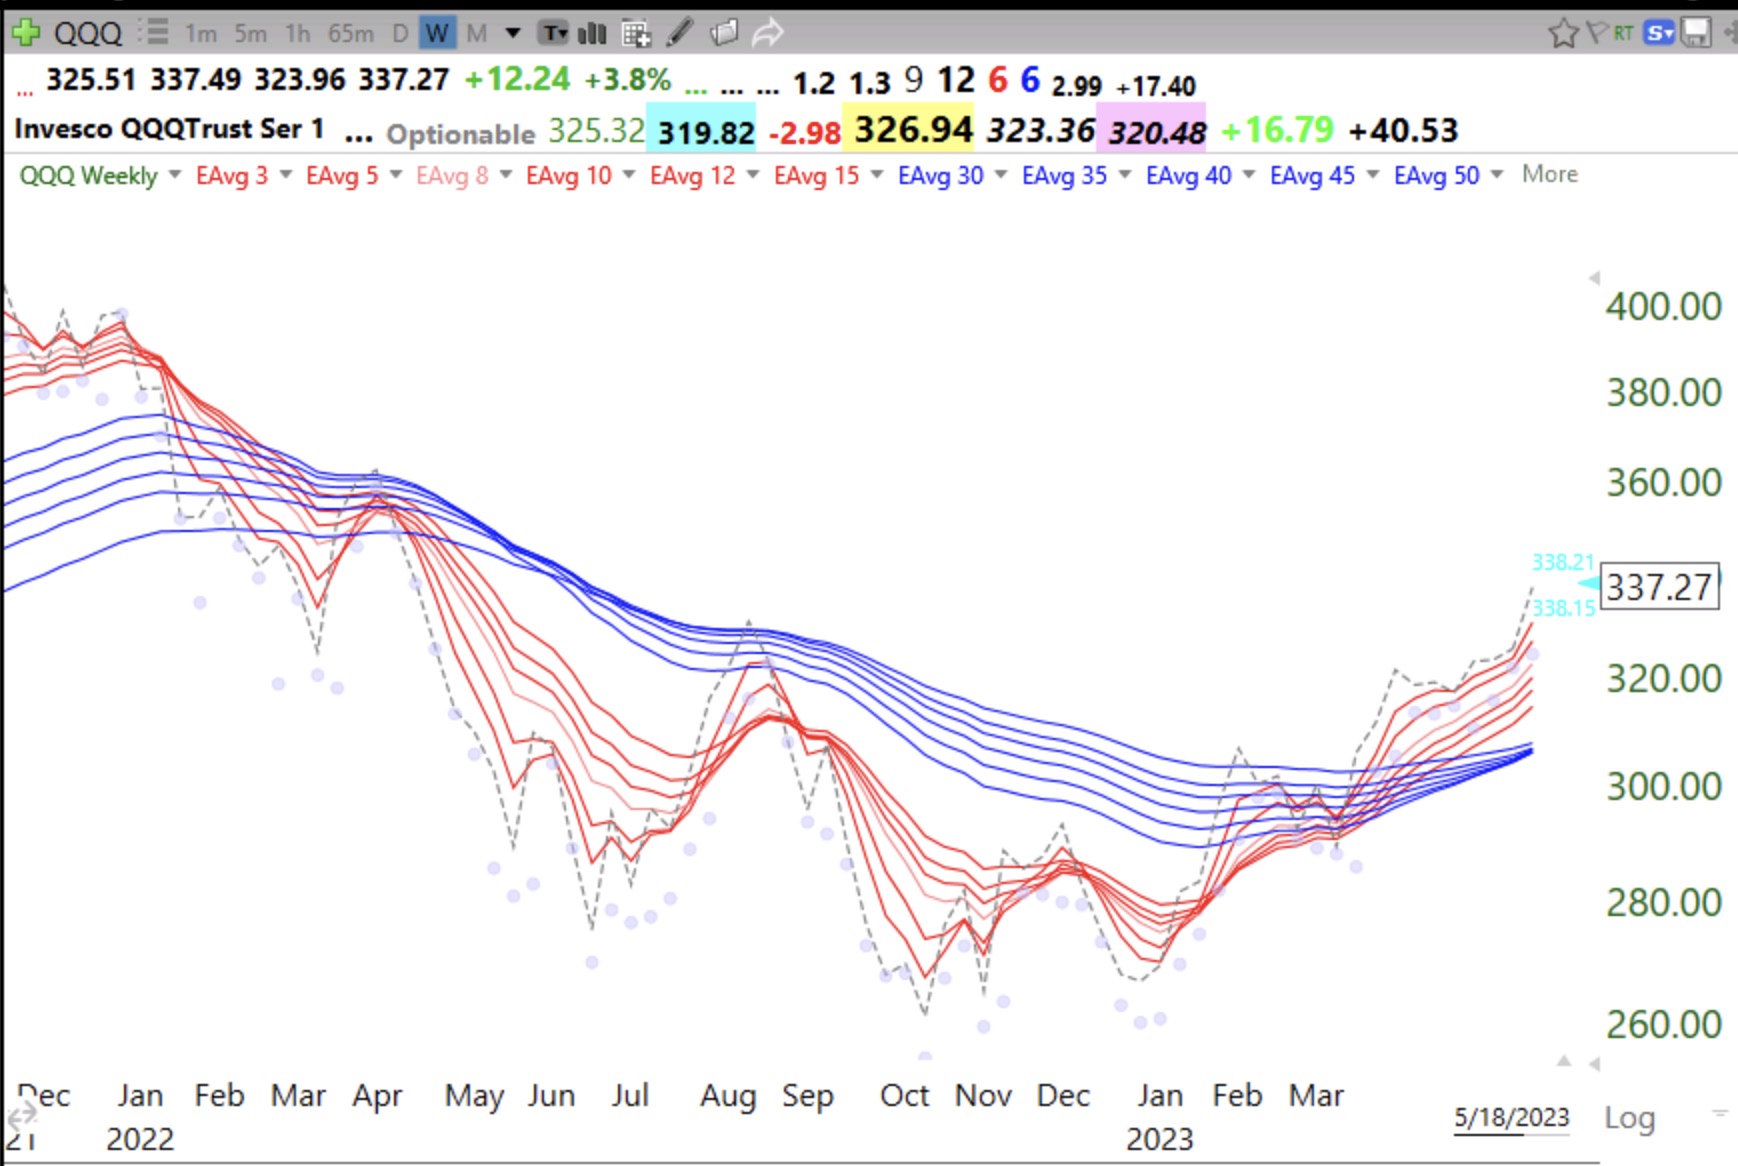
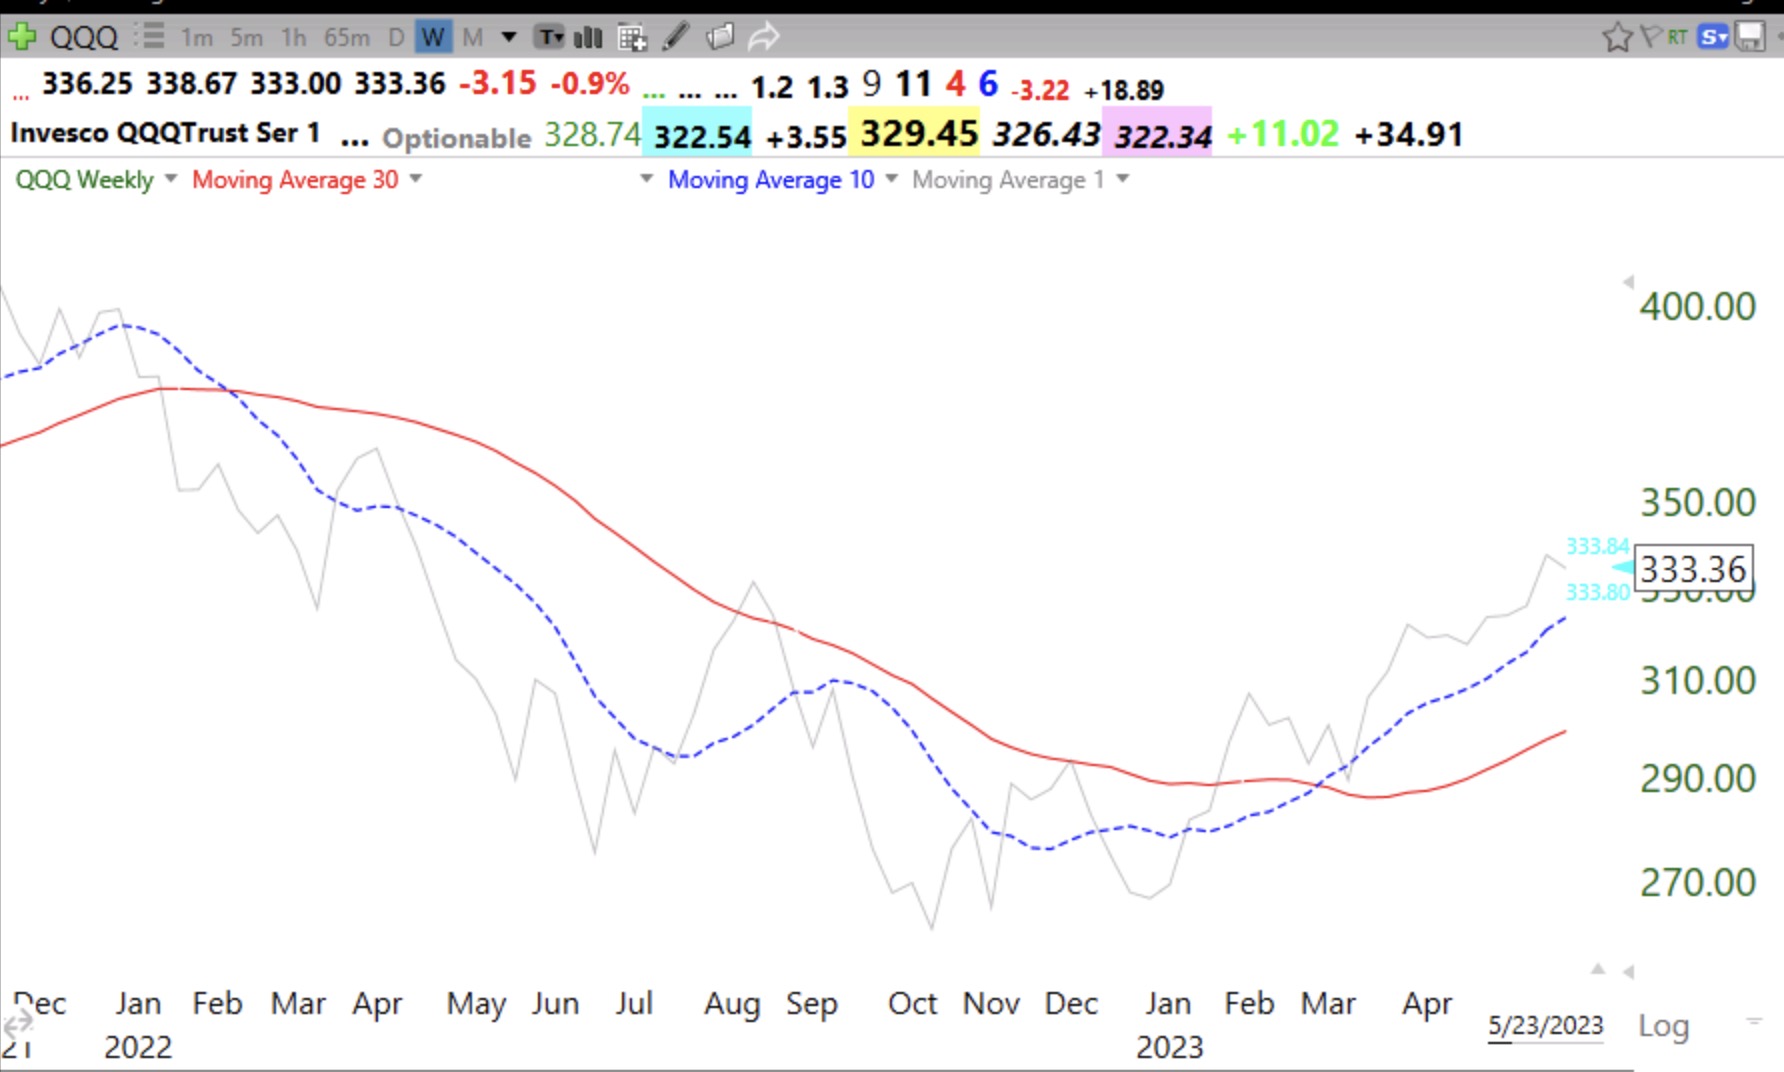
Note that the 10 week average (dotted line) is rising above the rising 30 week average (red solid line). In the past this has been the pattern marking the end of a major down-trend. Gray line is the weekly close.
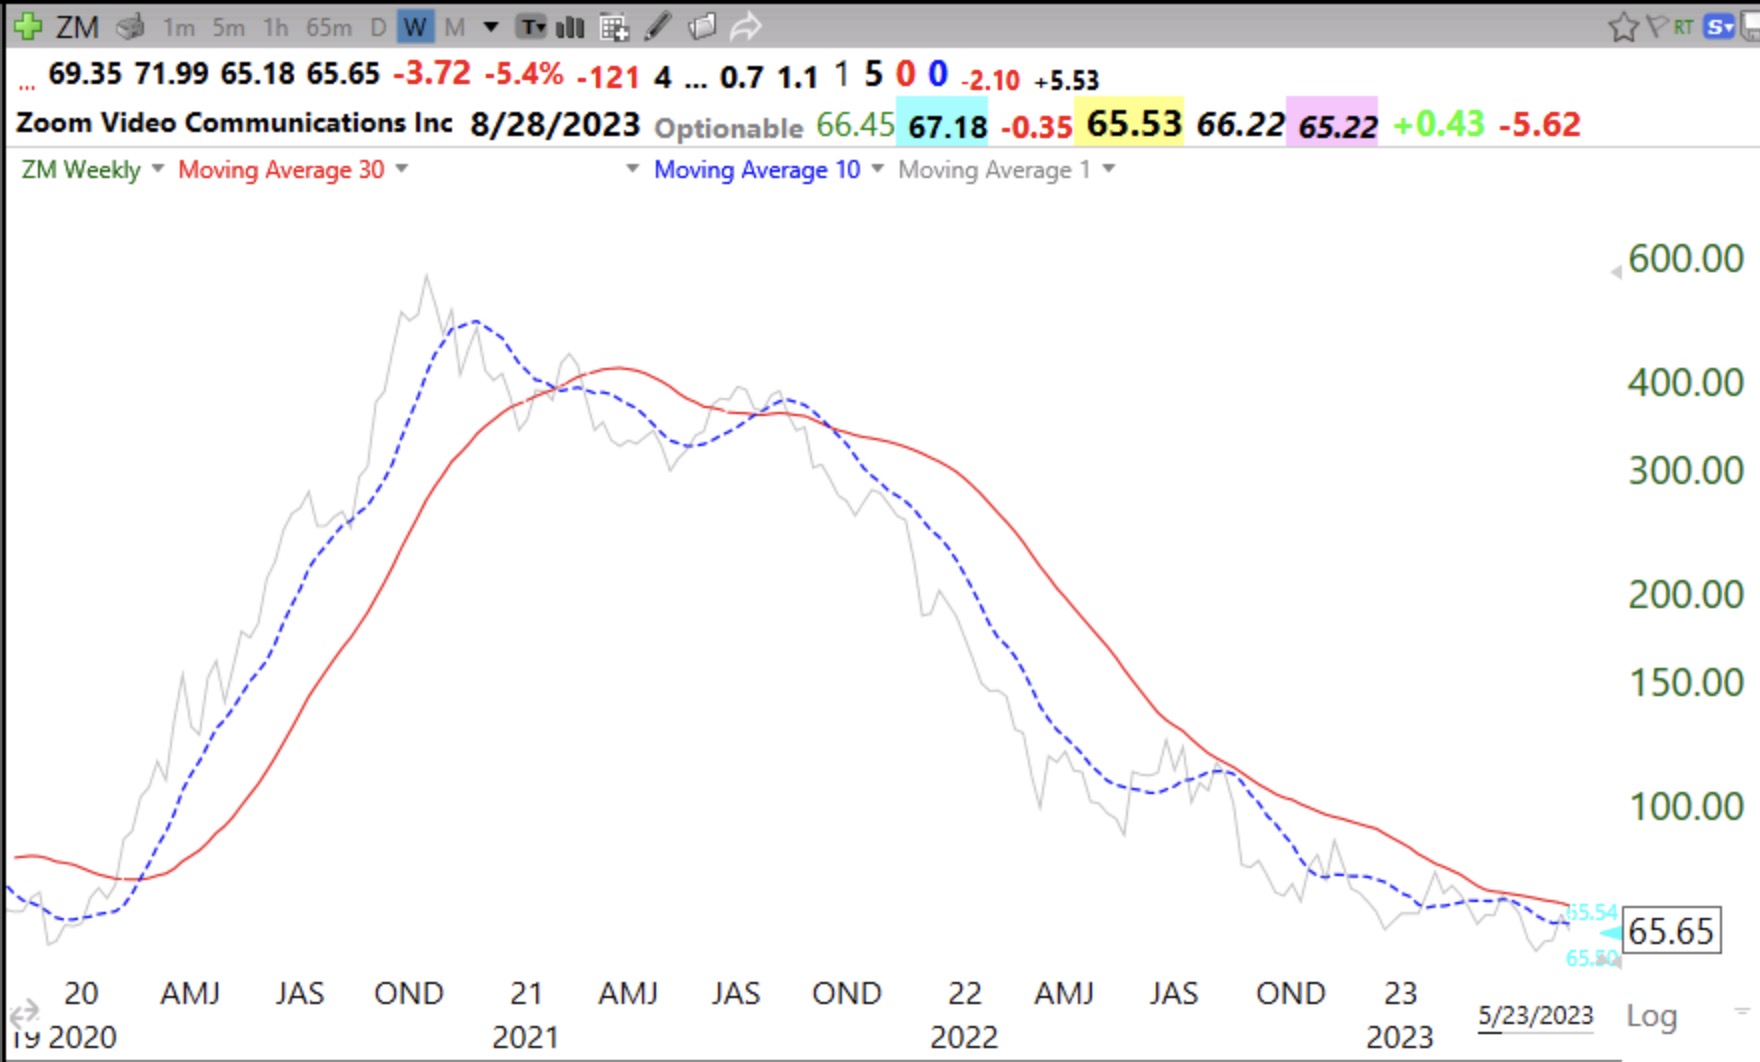
This pattern works for individual stocks too.
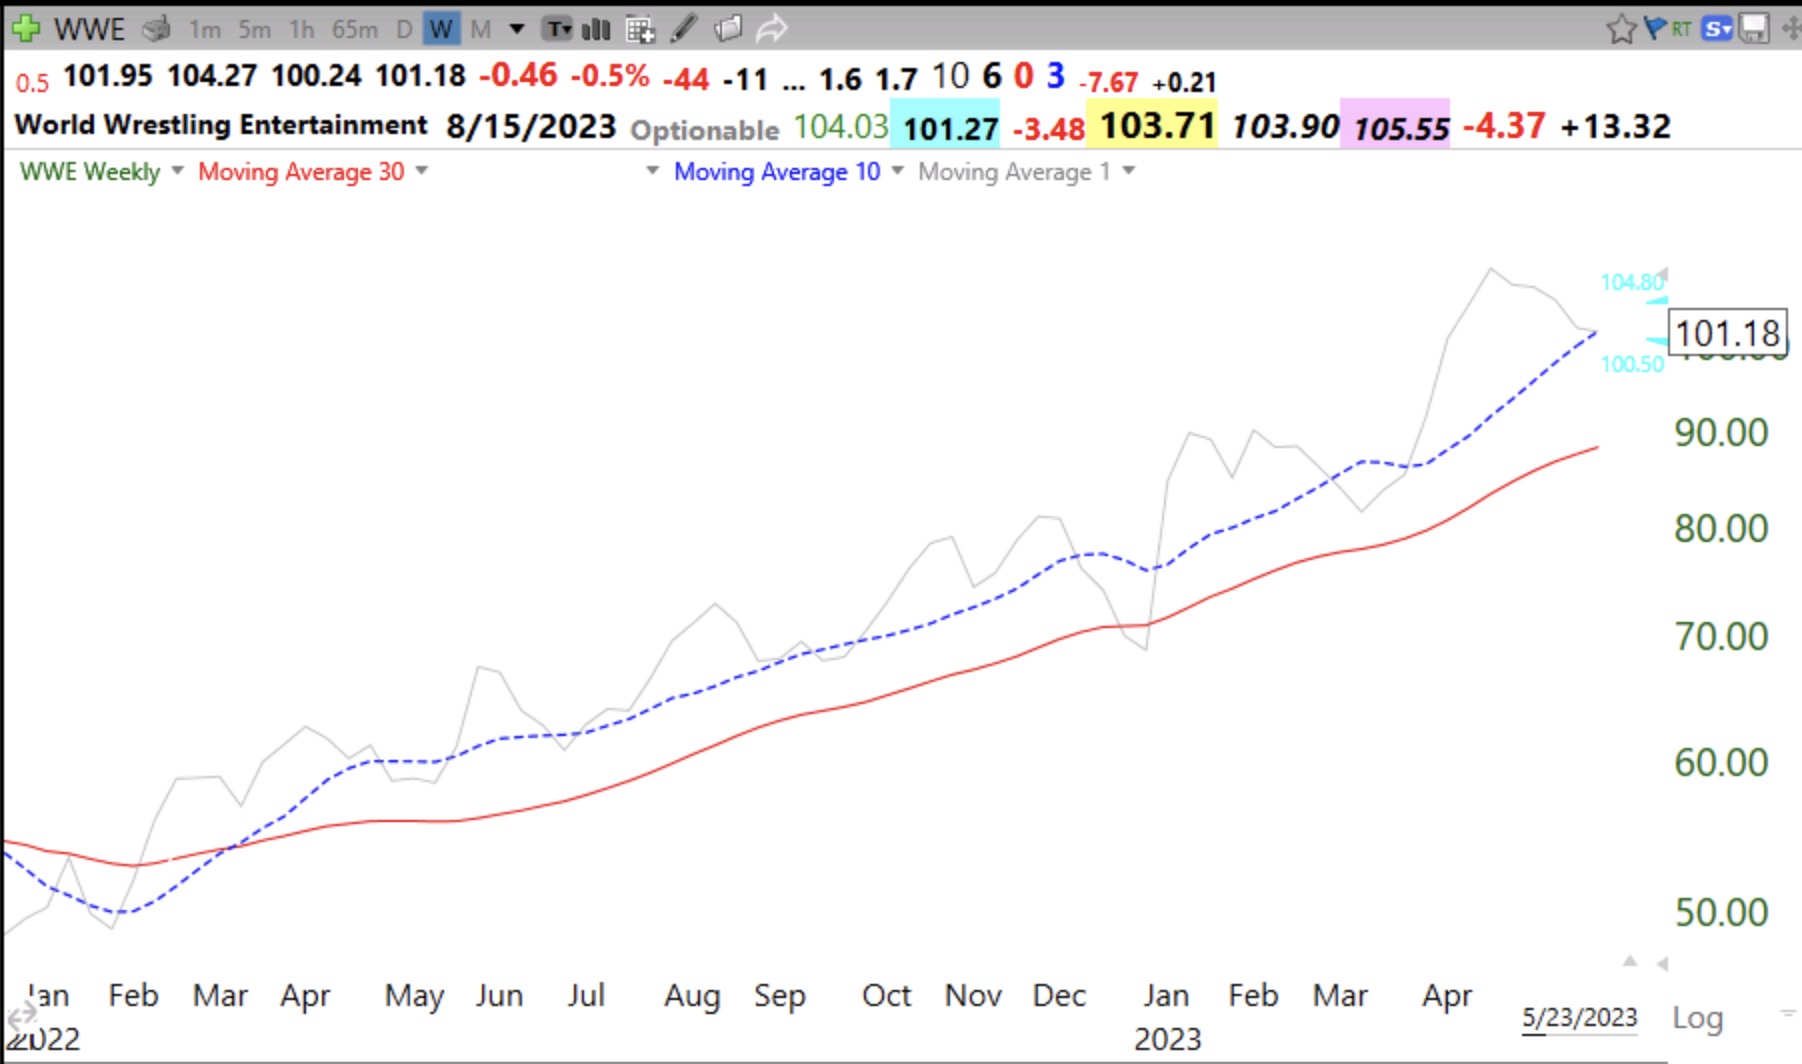
On the way up and then down.