Blog Post: Day 23 of $QQQ short term up-trend; Only 70 new US highs and 62 new lows; This weekly chart shows $SPY is at a critical point, another leg down on tap?

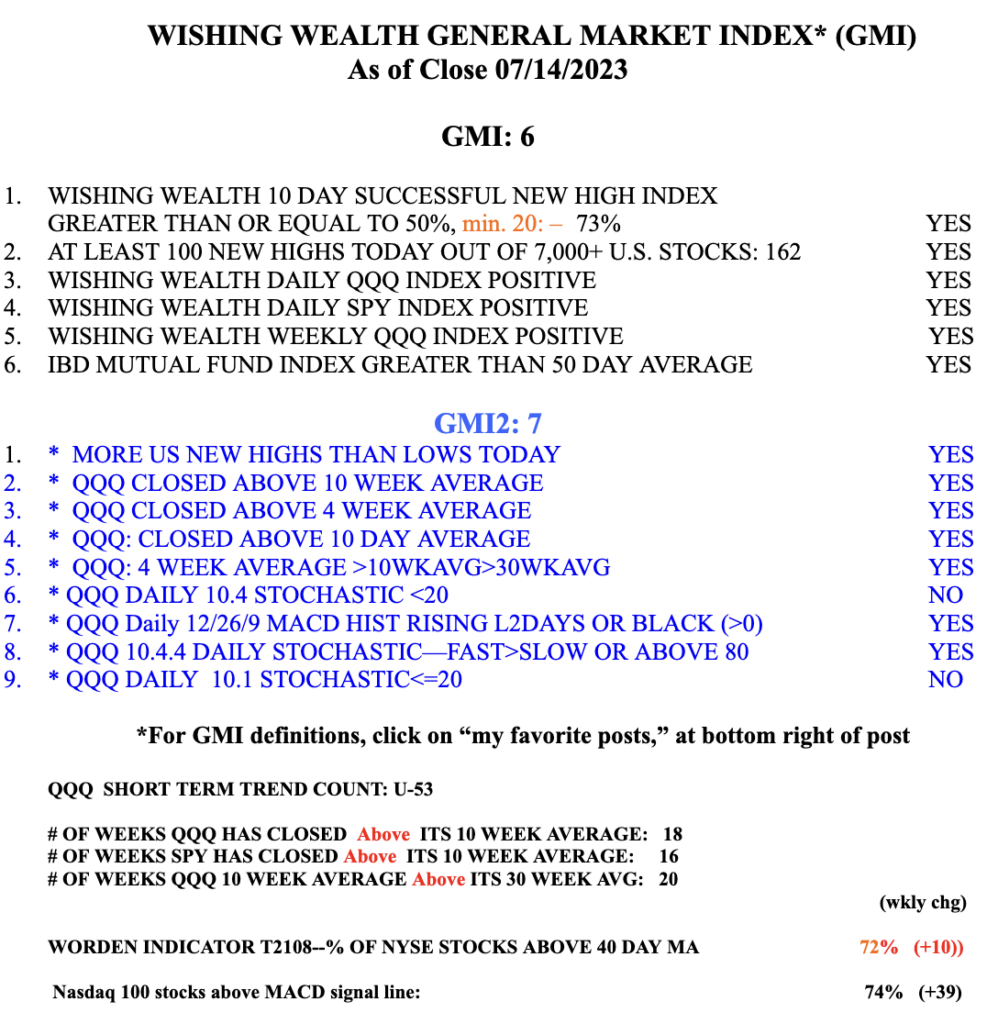
GMI5/6
GMI-26/9
T210877%

SPY is above its 30 week average (solid red line) but has hit a wall at its descending down-trend line. It is also floating above its 4 week average (red dotted line), a sign of being extended. If SPY should close back below its 30 week average it could signal another vicious leg down. Look what happened last April. Stay tuned and remain on defense…..


Blog post: Day 21 of $QQQ short term up-trend; GMI has been 6 out of 6 for 4 days; set-ups are working, look at $AAPL and create your own and share it!

GMI6/6
GMI-26/9
T210881%

I have written before that the best time for me to go long is when the GMI is on a Green signal. It has been Green since 7/21. Since then QQQ has advanced +8.35% and 83% of its stocks have gone up. The median change of the Nasdaq100 stocks is +7.5%.   The GMI rose to 6 (of 6) on August 10 and my set-ups are working again.

Study this daily chart of AAPL with its exponential 8 and 21 moving averages and see if you can make up rules for trading a rising stock. When would you buy and when would you sell? Next test them out on other stocks to confirm you have something tradable. Share your set-up with others in your comments. Last post I gave you a hint on what I do.