The GMI has been 6 for the past four sessions. 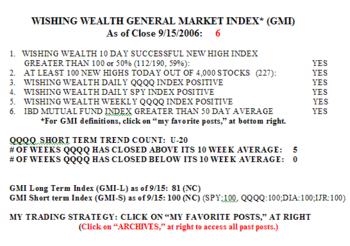 51-60% of the stocks in the Nasdaq 100, S&P 500 and Dow 30 indexes rose on Friday. There were 227 new yearly highs in my universe of 4,000 stocks. In addition, there were 112 successful 10 day new highs, indicating that buying new highs has likely to have been profitable. Friday was the 20th day in the current QQQQ up-trend. 81% of the Nasdaq 100 stocks closed above their 30 day average, compared with 71% of my stock universe. Thus, tech stocks are a little stronger.
Nevertheless, the performance of the IBD 100 stock lists has been spotty. Only 23% of the stocks on the list published on 5/15 closed higher on Friday than they closed on 5/15. Furthermore, only 49% of the stocks on the list published on 8/14 have closed higher. Thus, the majority of the IBD 100 stocks have closed lower since they closed on the lists published on these dates. The IBD 100 stock index performance published by IBD is heavily biased upward by the fact that each week they delete from the index (and its computation) as many as 20% of the worst performing stocks. (Why compute such an unstable index?) In comparison, on Friday, 89% of the Nasdaq 100 stocks closed higher on Friday than on 8/14. So the Nasdaq 100 stocks are vastly outperforming the IBD 100 stocks????!!!!!
I am looking at GOOG as a possible buy. Technically and fundamentally GOOG looks very interesting to me. A few weeks ago it looked like GOOG was ready to decline. Its 30 week average (red line) appeared to be reversing down. But last week the stock showed signs of life with a rise above its 30 week average on increased volume. 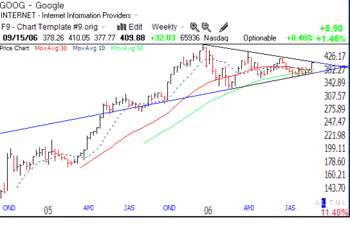 The stock closed near its weekly high and right up against its descending trendline. The fundamentals aren’t shabby either, last quarterly earnings +98% and a PE ratio of only 55. Maybe GOOG’s chart is revealing buying by insiders and institutions who expect more good earnings from this giant on October 19. If this tech rally lasts, GOOG could have a huge move, given this consolidation that dates back to the beginning of this year. I just might nibble at this stock if it can break through this trendline…….
Please send your comments to: silentknight@wishingwealthblog.com.
 The QQQQ up-trend is intact and in its 22nd day…..

