Bear trap; GMI: +6; WPM–DIA and QQQQ weaker; Scan for bouncers; ABLE or NOT-ABLE?

Well, I fell into a bear trap last week.  I started to talk about shorting when the GMI was still at +6.  How many times have I noted that one must go with the market trend–not try to anticipate it.  I was so disappointed with the way HANS and GOOG acted last week that I became prematurely bearish.  That is not to say that the market could not begin a decline this week.  The point is to act AFTER the decline has begun. Right now, the odds still favor those who are  long stocks…………………………

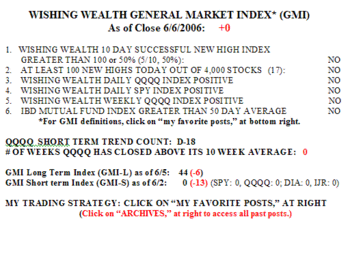
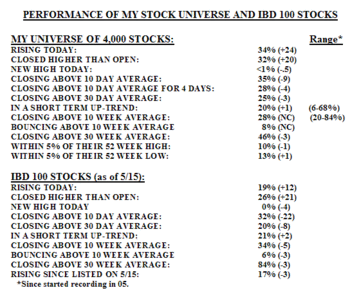
As the table shows, the GMI is at +6 and there were 290 successful 10 day new highs.  Thus, buying new highs 10 days ago was largely profitable.  Gmi722_2 There were also 257 yearly highs on Friday.  81% of the 4000 stocks in my universe closed above their 10 week averages and 64% are in a short term uptrend.  We are in the eleventh day (U-11) of the QQQQ rally. Still, it is troubling to me that many of the leaders are having sudden sharp declines (GOOG, HANS, SPTN, FTO NDAQ, ORCT, KOMG, LSCP).  If the leaders weaken, the rest of the market tends to follow……………………

The WishingWealth Pulse of the Market (WPM)  shows some differences in the performance of the indexes. Wpm722 All indexes are above their short term and longer term moving averages.  However, the SPY, MDY and IJR indexes are outperforming the QQQQ and the DIA.  In fact, less than one half of the Dow 30 stocks are above their 30 week averages, demonstrating considerable variation within this index.  Stocks in the Dow that are considerably below their 30 week averages include:  MMM, DD, C, JNJ, DIS, VZ.  GE is also below and seems to be weakening.  I NEVER buy/hold a stock that is trading below its 30 week average.  I thank Stan Weinstein for his invaluable insights about the 30 week moving average (see his book, listed to the right).  That simple rule alone has saved me $$$$ over the years…………………………….

I ran a scan for stocks that have been strong and seem to be bouncing off of their moving average.  I could not ignore the fact that the scan yielded a preponderance of oil related stocks– MSSN,PLLL,ECA,APA, PBR, RIG, PKD,PDC,SU.  Interestingly, ABLE also came up.  Able You may remember that ABLE tripled in about 10 days last May/June.  It then went into a consolidation for 6 weeks and showed some strength on Friday.  Note the volume spike to its 50 day average (horizontal blue line in volume section) on Friday.  This is the type of stock that might erupt again, if there is a follow through tomorrow.  A close below Friday’s low of 16.42 would be where I would place my sell stop if I were to buy it on a move above 18.55 tomorrow.  I am not going to buy ABLE tomorrow, however.  I am focusing instead on one of the oil related stocks I listed above……………………

If the market and the GMI do begin to weaken this week, I will begin to focus on buying puts on one of the index ETFs (DIA, SPY, QQQQ).  It is often easier for me to ride the downward trend of the market  than that of an individual stock…………………..

Send me your feedback at: silentknight@wishingwealthblog.com.
Slammed leaders and rising rates increase market risk; GMI: +6; shorts as a hedge

To my visitors: I am only one trader, not a guru, and not a financial advisor.  I am presenting my own opinions and my own experiences and people are welcome to decide for themselves what, if anything, on this site is of value to them.  Please refer to the additional comments, highlighted in red, at the end of this post.

Well, now I am a little concerned.  When stocks like GOOG and MSFT get slammed after reporting earnings, it may be time to take some money off of the table.  Yes, I know the GMI is still at +6, but if I wait for it to give a definite sell I will lose most of my profits.  If good earnings cannot support GOOG, then what type of news is left to support it?  Too many of the leaders are finding themselves in multiple point declines.  When the leaders get into trouble, the rest of the market is not far behind. Irx721 In addition, my short term interest rate indicator has gapped up and keeps hitting new highs.  Look at this ugly monthly chart of the indicator.  Note it took much less of an increase in rates from 1998-2000 to burst the market bubble.  Bonds also seem to be weakening.  Perhaps we are seeing the end of Alan’s conundrum.   I know I am not supposed to predict the market, but I have the feeling we are in for a rough period……………………….

The GMI remains at +6, but the 10 day new high index was weak today.  Gmi721_1 Only 92 of the 174 stocks (53%) that hit a 52 week high 10 days ago closed higher today than 10 days ago.  Only 17% of the Nasdaq 100 stocks and 16% of the S&P 500 stocks advanced today.  20% of the Dow 30 stocks advanced.  These are some of the weakest readings I have seen during an up trend–this was day 10 (U-10) of the QQQQ rally. There were 267 new highs in my universe of 4,000 stocks………………………………….

Maybe it is time to start looking for stocks to short, at least as a hedge.  I will run some scans soon.

Send me your feedback at: silentknight@wishingwealthblog.com.
Please remember that the stock market is a risky place, especially now.  I am not providing recommendations for you to follow.  My goal is to share tools and methods that I have used over the past 40 years of trading, so that you may learn from them and adapt them to your trading style and needs.  While I do my best, I do not guarantee the accuracy of any statistics computed or any resources linked to my blog.  Please consult with your financial adviser and a mental health practitioner before you enter the stock market,  and please do not take unaffordable risks in the current market environment.  See the About section for more statements designed to protect you (and me) as you navigate this market. Past performance does not guarantee future results, but I would rather learn from a former winner than a loser.

The Cramer Circus; GMI: +6; GOOG and IVGN

Did you see the Cramer Circus tonight?   It was   a live show complete with a hand picked audience filled with shouting fans and extreme adulation for JC.   Elmer Gantry could not have done better.   I   attended a speech by Jim Glassman around 2000, soon after he had published his book, DOW 36,000, in which he made the “rational” case for the bull market to exceed that figure. I remember thinking that if there ever was a sign of a bull market top, this was it.   And so I felt today.   It may not come tomorrow or this month or next month, but the Cramer show today smacked of froth and irrational exuberance.

We now know why the short term interest rate indicator rose and the closed end bond funds I wrote about declined   earlier in the week.   Alan is committed to more interest rate hikes.   It is my experience that when the market stops worrying about the higher rates and believes the economy can tolerate them, the bottom falls out of the market.   I think we are getting near that point.   Alas, October is always a good month for the market to bottom.

But I wait for the GMI to detect the change in trend.   And right now things are fine at a steady +6.   Gmi720 There were 250 successful 10 day new highs today and a whopping 423 new highs in my universe of 4,000 stocks.   One in ten stocks hitting a 52 week high–hmmm.   There were 10 new lows.   69% of the Nasdaq 100 and S&P 500 stocks rose today, along with 60% of the DOW 30 stocks.   This is day nine (U-9) of the QQQQ rally.

With EBAY’s stellar earnings release tonight, GOOG appears ready to take off toward that well expected $350 level.   Heaven help us if its earnings disappoint tomorrow. Ivgn By the way, I added more IVGN today. As this monthly chart shows, IVGN topped out in 2000 at 99.50 after a rapid run-up, declined until early 2003 and rallied and peaked again around $82 in 2004.   It began a new rally in August, 2004 and has recently broken through the   $82 prior 2004 peak.   IVGN’s earnings have been up triple digit.   The company provides supplies to many biotech companies. I think IVGN provides a way to ride the biotech boom without depending on new drug discoveries to power the stock.