GMI: +6; Short housing?

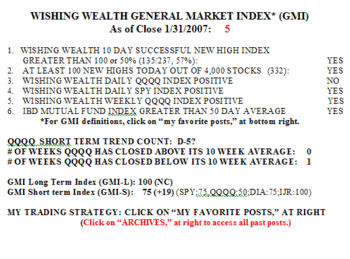
The GMI closed the week at +6, and the QQQQ showed signs of strength.  Gmi0303 There were 274 new 52 week highs on Friday and only 14 new lows in my universe of 4,000 stocks.  61% of the 327 stocks that hit a new high 10 days ago closed higher on Friday than they did 10 days earlier.  It is a sign of strength when many stocks hit a new high and retain a gain 2 weeks later.  51% of stocks are in a short term up trend, 30% are in a strong rise. Almost two thirds of stocks closed above their 10 week averages, indicating a longer term up trend.  Almost one third (32%) of stocks closed within 5% of their 52 week highs.

The WPM indicates that the Nasdaq 100 stocks did a little better than the other stocks last week.  Wpm0303 While all five indexes closed above their 30 day and 30 week averages, only the QQQQ showed an increase in the percentage of its component stocks that closed above these two  averages. The QQQQ may be playing catch up with the rest of the market.

The long term bonds weakened substantially last week, suggesting that Greenspan’s conundrum may have been resolved.  Tlt0303 This chart of the 20+ year Treasury Index shows an ominous curving down of the 30 week average.  In addition, the ten week average is below the 30 week for the first time since September, 2004.  The recent peak in this index is very close to the prior peak in June, 2003–a double top? The shorter term bond indexes have similar ominous charts.  Just when everyone agrees that the Fed has failed to drive long term rates up, will the Fed suddenly prevail?

Housing stocks continue to decline, and their demise may be just the first of the consequences of higher interest rates. Is it too late to short housing–or is this the beginning of a decline? Housing0303 The chart of the residential housing index looks to me as if it is completing the right shoulder of a head and shoulders top.  A close below 1705 would indicate  a major top and a decline to come. If I were a betting man, I would come down on the bearish side of this one.  If housing goes, what will happen to the rest of the economy?  We need to watch our indicators and charts very closely during this critical ninth inning of the economic recovery….

Please send your comments to:  silentknight@wishingwealthblog.com.

GMI:+6; QQQQ turns up; Biotechs to turn?

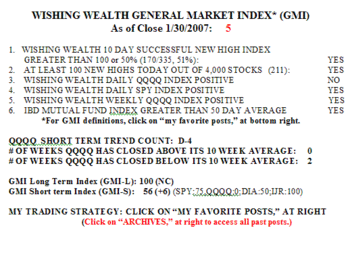
The GMI finally went to the maximum of +6, with the Daily QQQQ indicator turning positive.  Gmi0302 There were 238 new 52 week highs in my universe of 4,000 stocks.  This represents 6% of all stocks in my universe.  Compare this percent to the 25% of stocks that have doubled in the past year that hit a new 52 week high.  What more proof do we need than this to show that the strongest stocks tend to get stronger ? Nicolas Darvas (see his books to the right) was very wise to have used doubling in the past year as one criterion for  buying a stock.  All of my other indicators changed slightly yesterday.  41% of the Nasdaq 100 stocks rose on Thursday, along with 36% of the S&P 500 stocks and 40% of the Dow 30 stocks.  Still, Thursday was the first day of the new short term up trend in the QQQQ.  With all of the bearish sentiment around for tech stocks, it would be just like the QQQQ to start a major up trend.  Keep an eye on the biotechs, which may be forming a bottom.  The MACD for the biotech ETF, BBH, has recently had a bullish crossover.

Please send your comments to:  silentknight@wishingwealthblog.com.

GMI still +5; GMI-S: 88; QQQQ getting stronger; Some new leaders?

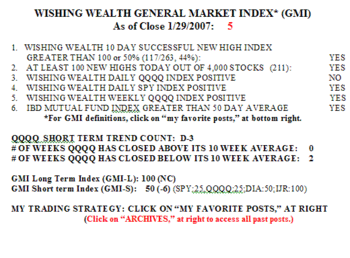
The GMI was again +5, and very close to a maximum reading of +6.  This is because the QQQQ came back strongly.  It closed back over its 30 day average and the MACD had a bullish crossover.  One more up day will turn the Daily QQQQ Index positive.  The growing strength of the QQQQ is also reflected in the rebound of the short term GMI-S, to 88.  The longer term GMI-L is at a maximum 100.  Gmi0301_1 There were 276 new 52 week highs in my universe of 4,000 stocks and 34% of the stocks are within 5% of a 52 week high.  74% of the stocks that hit a new high ten days ago closed higher on Wednesday than they did ten days earlier.  Buying stocks at new highs 2 weeks ago has therefore likely to have been profitable.  79% of the Nasdaq 100 stocks advanced on Wednesday, along with 73% of the S&P 500 stocks and 83% of the Dow 30 stocks.  55% of stocks are in a short term up trend, the most since February 3.  69% of stocks are in a longer term up trend.  Wednesday was the 18th and maybe final day of the recent short term down trend in the QQQQ………

A number of stocks with recent quarterly earnings increases of 100% or more had large volume (at least twice their 50 day average volume) moves up today.  They include:  SPW, TER, ATHR, WIRE, ASEI, ASTSF, ASF, JOYG and CYBS.  I own some of these.  The Nasdaq 100 may be about to break out on the up side.  Given that the leaders of a new rise often are among the first stocks to break out, this list may be worth watching.

Please send your comments to:  silentknight@wishingwealthblog.com.