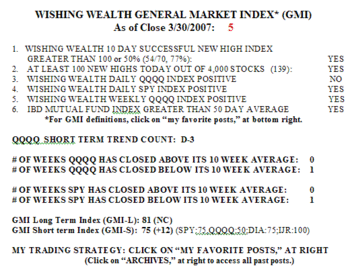
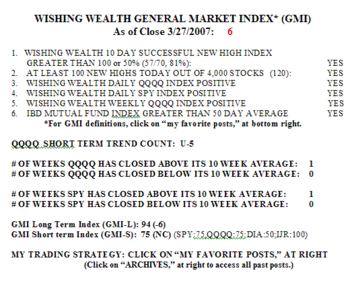
The GMI is still 5, and the QQQQ is in its  third day in its short term down-trend. Furthermore, the QQQQ, SPY and DIA index ETF’s have all closed below their 10 week averages. During such periods I am unlikely to make money by staying long. The 30 day average for the QQQQ has now completed a rounding top and is now declining. Since the Nasdaq 100 index reached its closing peak on February 22, that index has declined 4.16% and 78% of the Nasdaq 100 component stocks closed Friday below their close on 2/22; one half are down 5% or more from 2/22. Don’t fight the trend of the indexes–go with the odds.
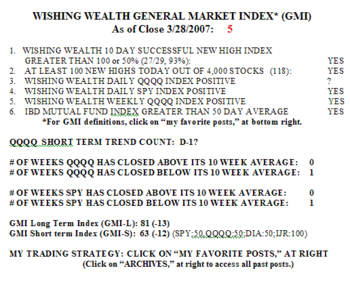
GMI: 5?
The GMI declined to 5, as it looks like the Daily QQQQ Index is probably negative. Only 3-16% of the stocks in the Nasdaq 100, S&P 500 and Dow 30 Indexes rose on Wednesday.  While I usually like to see two down days before I call a down-trend, the index looks so weak that I am comfortable calling the change in trend. The QQQQ and SPY are now below their 10 week averages. I am closing out my long positions.
See the bottom of yesterday’s post for my disclaimers.


