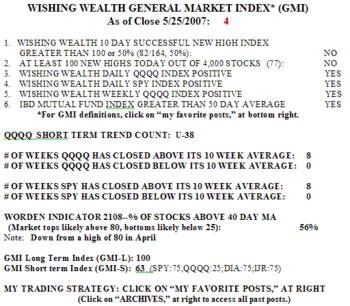
The QQQQ successfully tested short term support and the GMI returned to 5 on Tuesday and to 6 by the close on Wednesday. Too many leaders moving higher: RIMM, GOOG and AAPL. Will post tonight.
GMI: 4; GMI-S: 63; Critical juncture
The GMI has fallen to 4 for the first time since March 20. If the QQQQ fails to hold 46, the GMI will likely slip below 4, the point at which I begin to get defensive. There were only 77 new 52 week highs in my universe of 4,000 stocks on Friday. The Worden Indicator T2108 (% of stocks above their 40 day averages) is now at 56%, down from a high of 80% in April. The pendulum is thus swinging down, and whether it reverses before it reaches a market low below 25% is anyone’s guess. My similar indicator which tracks the percentage of Nasdaq 100 stocks closing above their 30 day a verages, is now at 49%, down from above 80% in late April, the lowest it has been since last March when the percentage was rebounding from a low of 11% in early March before the current rally began. So, we have some signs that this market is weakening. In addition, the MACD for the daily QQQQ is declining below its signal line and the MACD for the weekly QQQQ has failed to confirm the latest peak in that index. All of these indicators make me nervous about this market and I will watch it closely for signs of a crack. The key is to not jump the gun, but to wait for the market to change direction. For now, the trend is still up.
GMI: 6; No longer post daily-but when GMI changes; the ideal boomer strategy–writing covered calls?
I have found that posting daily takes too much time and is not really necessarily. I have a full-time job and have developed a trading strategy that aims for gains over weeks, not days. It is not necessary and is, perhaps, detrimental to take the pulse of the market too often. I have therefore decided to post less often and to post at a minimum whenever the GMI changes. A doctor can gain an idea of my health by checking my blood pressure or lipids, etc. on an infrequent basis. Imagine how many wrong decisions would be made if these measurements were taken minute by minute of even daily. For me, the larger trend of the market is what I need to know to trade successfully.
For example, the GMI has been 6 since April 3. During that period the Nasdaq 100 stock index has risen 6.5% and 69% of its component stocks have advanced; 45% are up 5% or more. By focusing on the GMI, I could have had a 69% chance of picking a winning stock–that is the odds I get from trading individual stocks when following the longer market trend. Roughly 70-80% of stocks follow the relevant market averages. The QLD, the Proshares Ultra QQQQ ETF that attempts to double the performance of the QQQQ, advanced 12.3% in this same period. By trading the QLD, I do not have to hope that I have picked a winning individual stock–during this period the QLD outperformed 76% of the Nasdaq 100 stocks. Thus, only 24 of the Nasdaq 100 stocks did better. I like the odds of trading the QLD, rather than individual stocks, in an up-trending market, as indicated by the GMI….
Because I am a boomer and have acquired a sizable trading capital in my IRA, I have become more conservative lately in trading growth stocks. I am now reluctant to pile into a break out stock and assume the risk of a sudden down-turn. I have therefore been training myself in the relatively conservative strategy of selling one month covered calls on stocks I own that are in an up-trend. Using this method I write a few calls in many different up-trending stocks so that I limit my risk. Applying this method in a rising market, I have been able to achieve returns of 2-4% each month–five to ten times the .4% monthly returns I get by leaving my money in a money market fund. On option expiration day most of my stocks are called away and I get to reassess the market trend and select individual stocks for new writes. If it is true that 70-90% of all options expire worthless each month, why not behave like the casino and take in the option buyers (bettors) money into our IRA’s? Like any trading strategy, this not the Holy Grail, and requires study and on the job training. Leave a comment if you want me to post more about this best kept secret.
See my prior post for my important disclaimers.
