GMI: 0; IBD100 performance; Cash balances earning 4.8%?

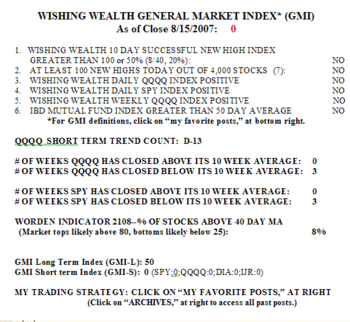
The GMI is still at zero.  There were 300 new lows and just 16 new highs on Friday.  The last time we had more than 300 new lows (324) in my universe of 4,000 stocks was October 12, at a near term bottom.  However, many of my indicators, while low, are not at extreme lows.  For example, 14% of the Nasdaq 100 stocks closed above their 30 day average, compared with 9% on June 13.  Gmi0714 The GMI-S is now at 19, reflecting weakness in almost all of my short term indicators for the four major stock indexes.  The GMI-L is only a little better, at 31. 21-27% of the stocks in the Nasdaq 100, S&P 500 and Dow 30 indexes advanced on Friday. Friday was the seventh day (D-7) in the current QQQQ down-trend and the ninth week that the QQQQ has closed below its 10 week average.  The IBD mutual fund index is below both its 50 day and 200 day moving averages and the 50 day is close to crossing below the 200 day.  Thus, the professional growth fund managers are suffering in this market, another indication to stay away from growth stocks now.

The IBD 100 stocks continue to be slaughtered.  Ibd0714 I think that the way IBD tracks  the performance of the IBD 100 is very misleading because they keep replacing underperforming stocks with better performing stocks.  When you look at the performance of the IBD 100 list published on a  particular date (5/15) we get a more accurate indication of how these types of stocks have performed.  Since 5/15, only 19% of the IBD 100 stocks have advanced, compared with 27% of the 4,000 stocks in my universe.  Only 26-27% of the stocks in each group closed above their 10 week averages.  None of the IBD 100 stocks and less than 1% of my universe of stocks hit a new high on Friday.  Need any more evidence that growth stocks have been a dismal investment since mid-May?

I am  100% in cash now, given my coming vacation.  Since mid-May it has  been almost too easy to trade profitably on the short side.  Buying deep in the money puts in my IRA has been a wonderful strategy for this market.  I urge all readers to get a copy of O’Neil’s book on shorting and to study the charts.  A current scan of the market using TC2005 yields 7 rocket stocks and 422 submarines.  Riding submarines down or staying in cash has been the best way for me to ride out the current market.  With Fidelity Cash Reserves paying me about 4.8% for the cash balance in my account, it is nice to be on the sidelines.  What is your brokerage firm paying you for your cash balances? You may be surprised/disappointed……….

Please send your comments to:  silentknight@wishingwealthblog.com.

GMI: 0; In cash or short

The GMI returned to zero on Thursday.  Between 10-16% of the stocks in the Nasdaq 100, S&P 500 and Dow 30 indexes advanced.  Only 13% of my universe of 4,000 stocks advanced, as did only 9% of the IBD 100 stocks listed on 5/15.  Gmi0713 There were 24 new highs in my stock universe and 249 new lows.  On June 13 there were 13 new highs and 292 new lows, so we are approaching the depths of the decline in mid-June.  18% of the Nasdaq 100 stocks closed above their 30 day averages. Put another way, only 18 of the Nasdaq 100 stocks closed above their average closing price over the past 30 days.  Only 29% of my universe of stocks are in a bullish Stage 2 up-trend, as defined by Stan Weinstein (see his book, listed on the right). 17% of my universe of stocks are within 5% of a new low, while just 9% are that close to a new high.  Approximately 3 of every 4 stocks closed on Thursday below the price they closed on 5/15…….

With the GMI at zero, I hold no stocks in any account.  There will be plenty of time to buy stocks again after the inevitable real turn occurs, sometime in ………………………

Please send your comments to:  silentknight@wishingwealthblog.com.

GMI: +2; GMI-S: 44; Cash and short

The GMI remains at +2.  While few stocks rose on Wednesday (18% of the Nasdaq 100, 17% of the S&P 500 and 7%of the Dow 30 stocks), my market readings are not as low as they were in June.  There were 127 new lows in my universe of 4,000 stocks on Wednesday, compared with 292 on June 13 and 173 on June 28.  Gmi0712_1 The short term indicators measured by the GMI-S has now fallen to 44; the GMI-L is 31.   14% of stocks are within 5% of a new low and 12% are within 5% of a new high.  Wednesday was the fifth day of the QQQQ down-trend (D-5) and the QQQQ has been below its 10 week average for nine weeks.  I have found that I profit from owning growth stocks when the QQQQ remains above its 10 week average.  In my opinion, anyone holding stocks in the current market should examine their strategy.  The markets of 2000-2002 should have taught everyone the folly of a buy and hold strategy.  Only 28% of the IBD 100 stocks from 5/15 and 33% of the 4,000 stocks in my universe closed higher on Wednesday than they did on 5/15.  Since mid-May, the odds of success have been on the side of those who are in cash or short.  That is the side I am on.

Please send your comments to:  silentknight@wishingwealthblog.com.