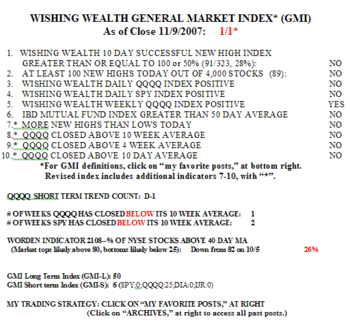
The GMI is now zero, as is the GMI-R. There were fewer new lows on Monday than on Friday (192 vs. 335) in my universe of 4,000 stocks. The Worden T2108 indicator is at 19%, now in the area where prior market declines have bottomed. Nevertheless, Monday was the second day in the current QQQQ short term down-trend and I have no idea how long this decline will last. I remain in cash and short the Nasdaq 100 in the QID ultra short ETF.
GMI: 1; GMI-R:1; Trend is down; in cash or short
Don’t try to fight the tide. The GMI (and GMI-R) is now one and the QQQQ is in its first day of a short term down-trend (D-1).  (Click on chart to enlarge.) The QQQQ as well as the SPY are now below their 10 week averages. I rarely make money trading growth stocks when the QQQQ is below its 10 week. In addition, the Worden T2108 indicator is now at 26%, in bearish territory but not low enough to be in bottoming territory. The major indexes are now all in down-trends. And it looks to me like this decline is just beginning, not near its end.
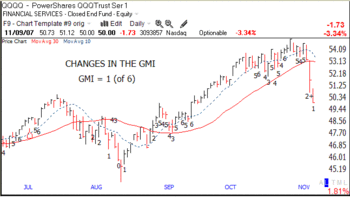
This chart shows changes in the GMI over the past few months.  (Click on chart to enlarge.) Note that the QQQQ has just broken below its 30 day average (red line) and that the 10 day average (blue dotted line), while declining, has yet to close below the 30 day. Looking back to the decline last August we can see a lot more damage then than now. While there is no guarantee that the current decline will last as long as the one last August, it could be worse. Under these conditions it makes no sense to be long stocks. Look how long we had last September to jump on board the up-trend, well after the August bottom. It makes much more sense to wait for a bottom to be in place before committing funds. Trend followers follow trends, they do not, cannot, anticipate them. To fight this down-trend by owning stocks is to be reduced to the level of gambling. Much better, and more likely to profit, is to wait and jump on the train once it has turned.
GMI:3+; GMI-R: 4+; BEGINNING a major decline?; Mainly in cash
Well, the QQQQ finally got in synch with the rest of the market on Thursday. There were 519 new lows and 89 new highs in my universe of 4,000 stocks. The last time we had as many new lows was on August 16 (556) at the bottom of last summer’s decline. But wait a minute. The QQQQ is just about to break its up-trend–Thursday is its first close below the critical 30 day average since August 28. I usually wait for one more such close to turn my Daily QQQQ indicator negative, hence the GMI and GMI-R readings with a "+. " And the IBD growth mutual fund index has just closed on its 50 day average and could pierce it today. In addition, the Worden T2108 indicator is still above bottoming territory (now 31% versus 11% last August) and 26% of the stocks in my universe are in an up-trend compared with just 11% at the bottom in August.
All of these indicators are clearly above the extreme low readings that we had last August, suggesting to me that this new decline in the QQQQ may turn vicious and do a lot more damage than we experienced during last August’s decline. I therefore sold everything on Thursday and bought a little of the QQQQ inverse ETF, QID, that rises twice as much as the QQQQ falls. This is the time for me to be on the side-lines, mainly in cash.
