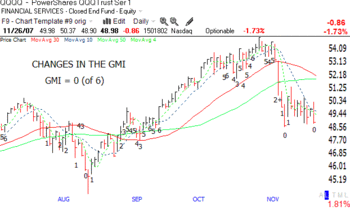
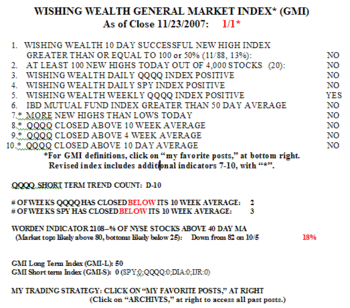
The GMI and GMI-R are back to zero.  (Click on the figure to enlarge.) The QQQQ is in the eleventh day of its short term decline. Only 3% of the Nasdaq 100 stocks closed Monday above their 30 day averages. This is the lowest percentage since I began recording these stats two years ago. The fact that the GMI is now zero and that many of my indicators are hitting new lows suggests to me that the market is entering a longer term decline. Anyone who refuses to go to cash and is holding on to stocks should examine his/her motivation. It took me almost 40 years to learn to get out of the market when it is in a confirmed down-trend and to avoid giving up my profits from the prior rally. As the great trader Jesse Livermore used to say, we should fear when a stock falls and hope when it rises. Most unsuccessful traders, he maintained, do the opposite. They hope for a profit when they have a loss and fear losing a profit when they have a gain. Most people holding stocks now are reduced to praying for the market to bail them out. As Livermore once opined during an imminent decline, such persons are now about to suffer amputation without an anesthetic………….
GMI: 1; GMI-R: 1; Not in stocks
I guess some of you probably thought that now that I am 100% in cash, this must be the bottom! It could be, but my track record in avoiding major declines has been quite good. I am a chicken and would rather get out and be proven wrong than stay in and suffer a large loss. The media pundits make us think that we must be invested all of the time so that we will not miss the next rise. But this is horrible advice. Any advance worth trading lasts months and one can wait for the train to leave the station and still hop on for a long trip. The advance that just ended lasted 50 days, the prior advance lasted 80 days, and the one last December lasted 86 days. So what’s the need to hurry?
Fighting the trend of the major indexes is a loser’s game. Since the beginning of the current decline (identified by my definition, D-1) on November 8, the QQQQ has fallen 3.7%. During that time, 87% of the Nasdaq 100 stocks have declined. What about the other stocks not measured by the QQQQ? 75% of the stocks in the S&P500 declined (including one that is unchanged) along with 80% of the Dow 30 stocks and 65% of the S&P 600 smallcap stocks. With odds like these, why would anyone be looking for stocks to buy??!! At least one could go short and have the trend in his/her favor. Do you see why I get out of the market or go short when the GMI breaks down? Only 25% of the 4,000 stocks in my universe rose during this period; only 16% rose 2% or more.
So I am content to remain in cash until the GMI rises.  (Click on table to enlarge.) The only indicator still positive is the Weekly QQQQ Index, which is just sitting on support. (The analogous indicators for the S&P500 and Dow 30 turned negative 3 weeks ago.) It is only the lack of financial stocks in the QQQQ that is making this index outperform the others. Buying stocks at new highs is a loser’s game now. Only 11 of the 88 (13%) stocks in my universe that hit a new high 10 days ago closed higher on Friday than they did 10 days earlier. Compare this number to the 363/519 (70%) of stocks that hit a new low and have closed lower–far better odds to short new lows than to buy new highs.
I do not know when this decline will end–nor does anyone else. We could be at the end of a correction or at the beginning of a many month decline. It does seem odd to me that the QQQQ declined about 11% in four days and still has not mounted much of a bounce back rally. With conditions like these, I prefer to watch from the sidelines.
GMI:1;GMI-R:1; 100% cash
This market looks so bad that I am now 100% in cash, both in my IRA and in my university pension. This is not the time for me to be a hero and there will be plenty of time to enter the market when the current down-trend ends. It amazes me to hear the media pundits looking for stocks to buy. I guess they don’t make money unless people trade.

