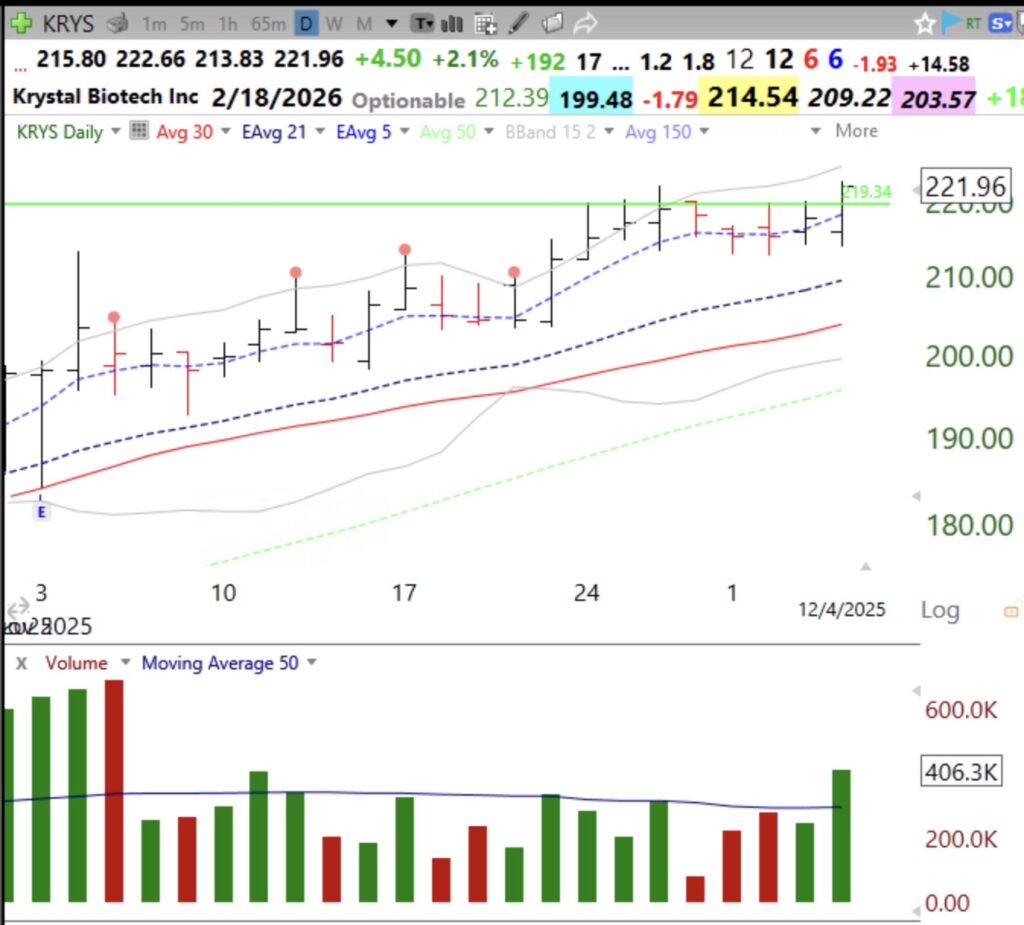
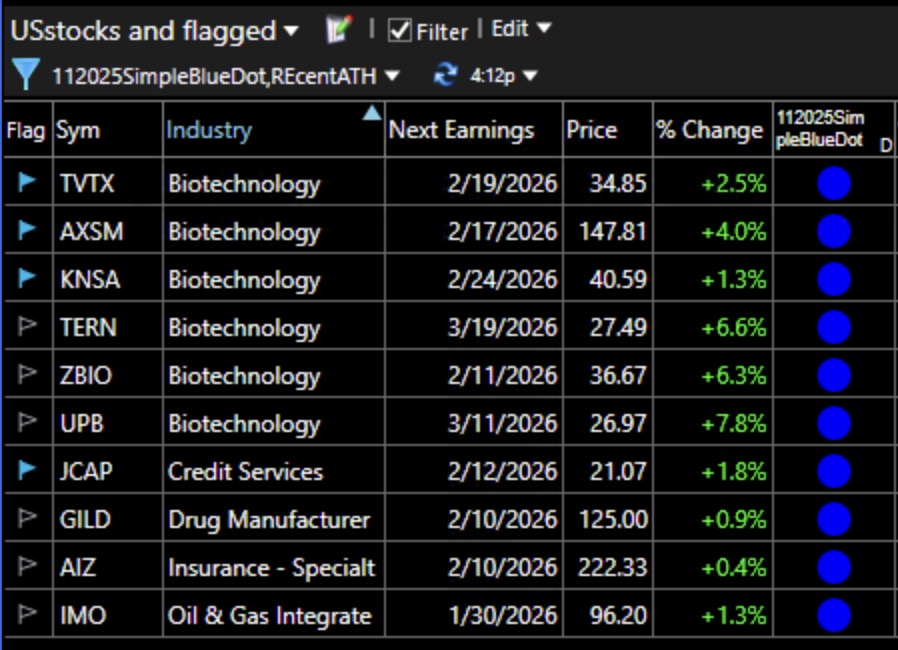
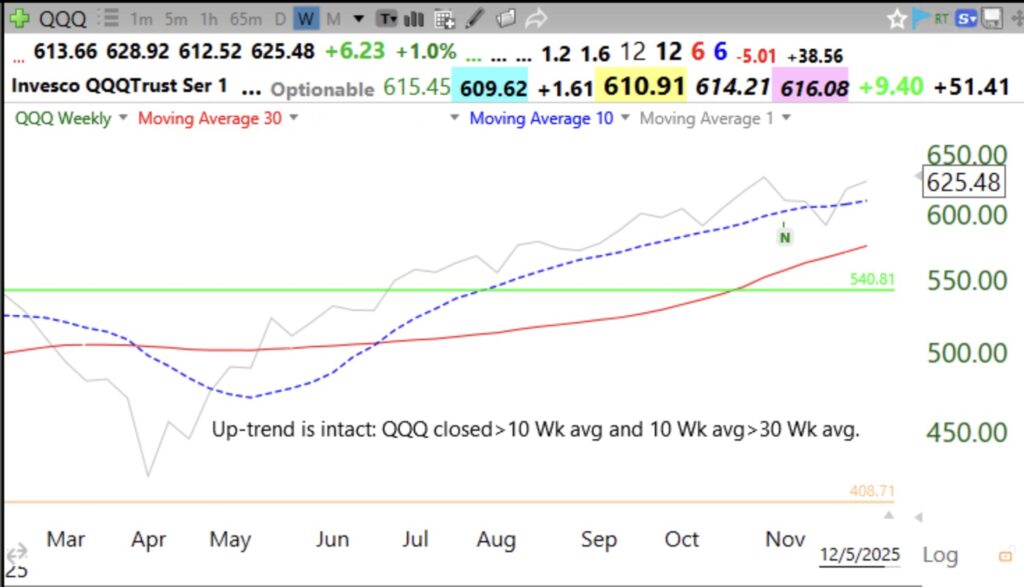
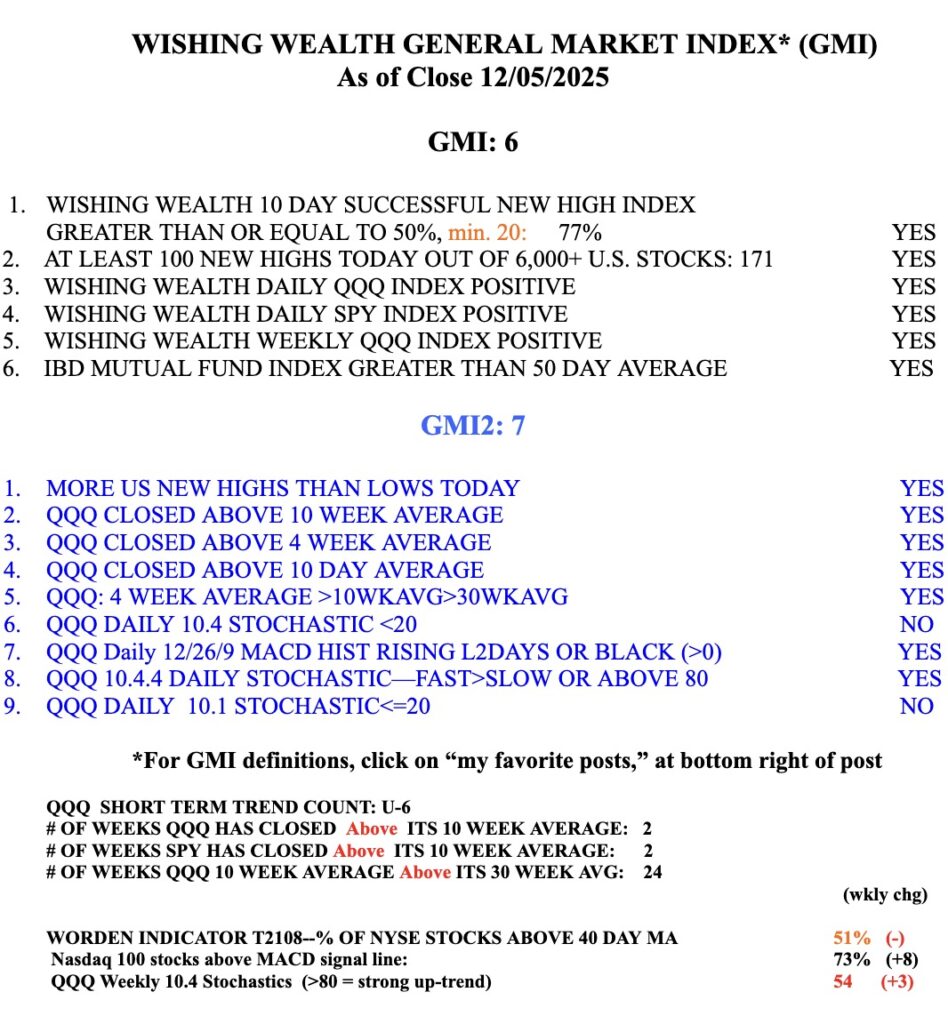
Blog Post: $QQQ short term up-trend continues but the GMI remains RED; On Friday, QQQ and 75% of its stocks traded at or below their 15.2 daily lower Bollinger Bands. Friday’s low for QQQ, 509.29, needs to hold. See my weekly 10:30 and daily modified GMMA charts; Santa rally?

GMI2/6
GMI-22/9
T210821%

Friday was Day 32 of the current QQQ short term up-trend; It held. However, 79% of the Nasdaq 100 stocks advanced, compared with 58% of all US stocks. Growth stocks are again leading the market up. But my GMI=2 and is RED for the second day. QQQ, DIA, IWM and SPY reached very oversold levels on Friday. These levels are where these indexes typically bounce. If these lows do not hold, I suspect a larger decline is imminent. The good news is that QQQ remains in a solid longer term up-trend, as shown by my 10:30 weekly chart. QQQ is above its rising 10 (dotted) and 30 week (red) averages. Several closes (gray solid  line) below  the 30 week average would threaten this Stage 2 up-trend. Until then,  QQQ is still in a sustained  up-trend.

The modified GMMA daily chart shows that QQQ remains in a RWB up-trend. Note Friday’s bounce up off of the longer term, blue averages. Dotted line shows daily closes. Is the Santa Claus rally upon us?

Here are the components of my GMI. T2108  is at 21%, far above the levels where a major decline ends. But is this a major decline? Happy Holidays to all!

Screenshot

Blog Post: The $QQQ short term up-trend may end Friday; GMI has flashed RED; When asked why he did not short stocks during declining markets, the great trader, Nicolas Darvas, answered thus; I share this quote with my class of undergraduates each year

GMI2/6
GMI-23/9
T210818%

Nicolas Darvas and William O’Neil did not fight the general market’s trend.I find it so much easier to ride stocks profitably when they are surging to new highs when my  GMI>=5. The General Market Index (GMI) is now 2. I am mostly in cash in my trading accounts.

Screenshot