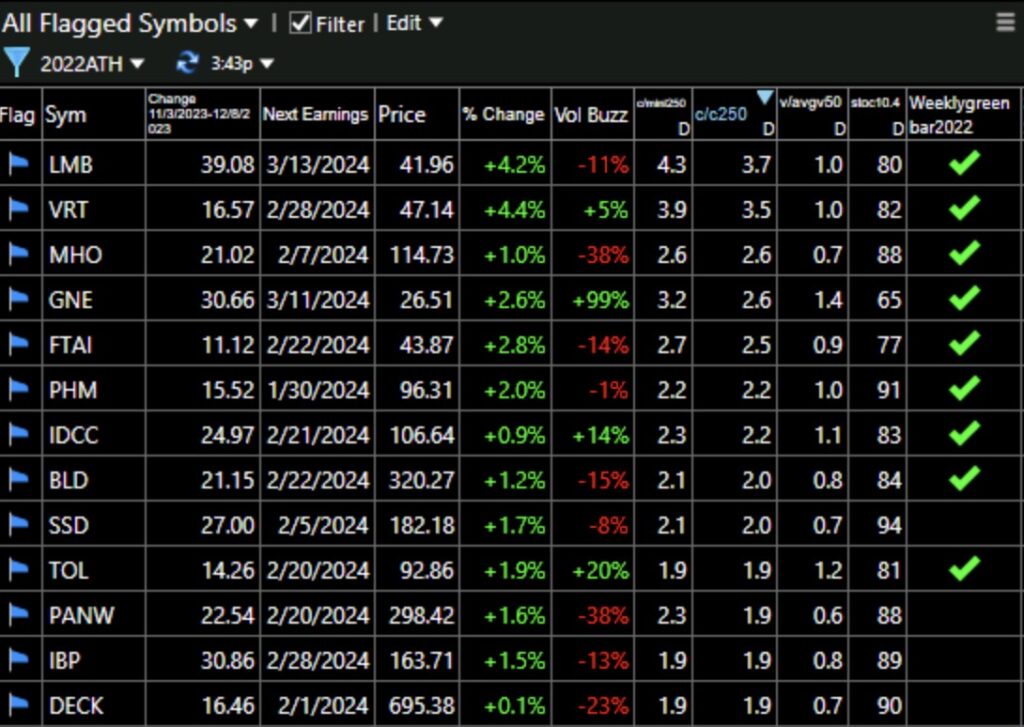
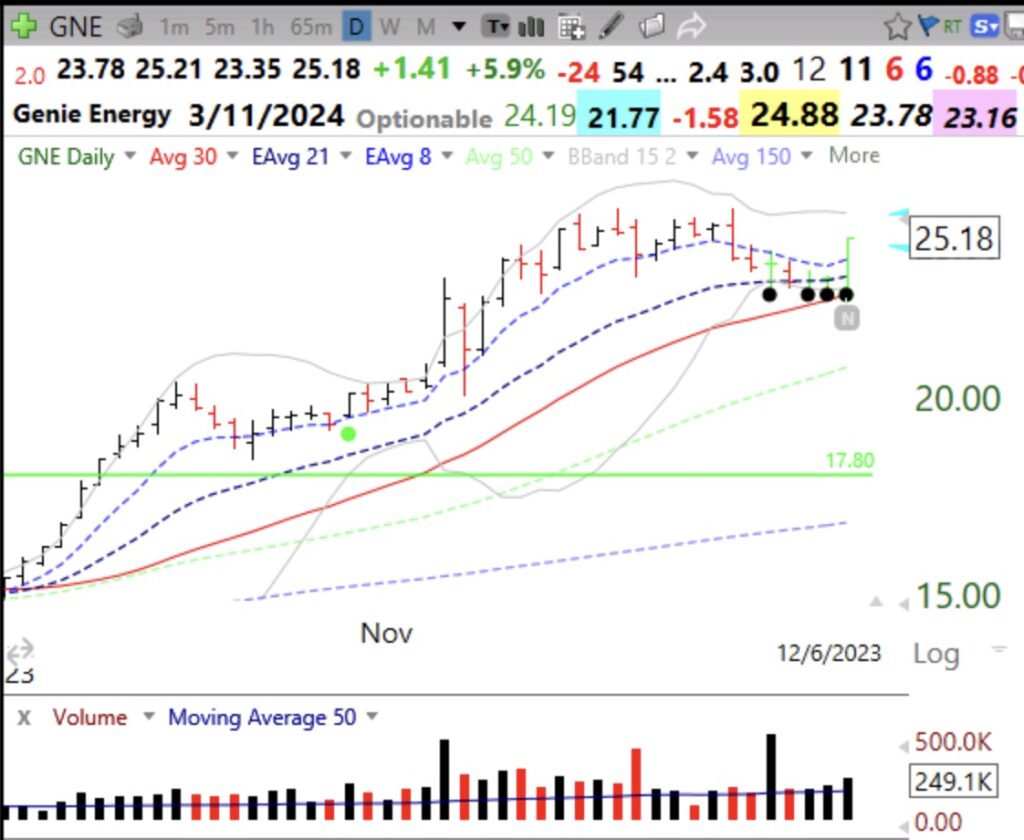
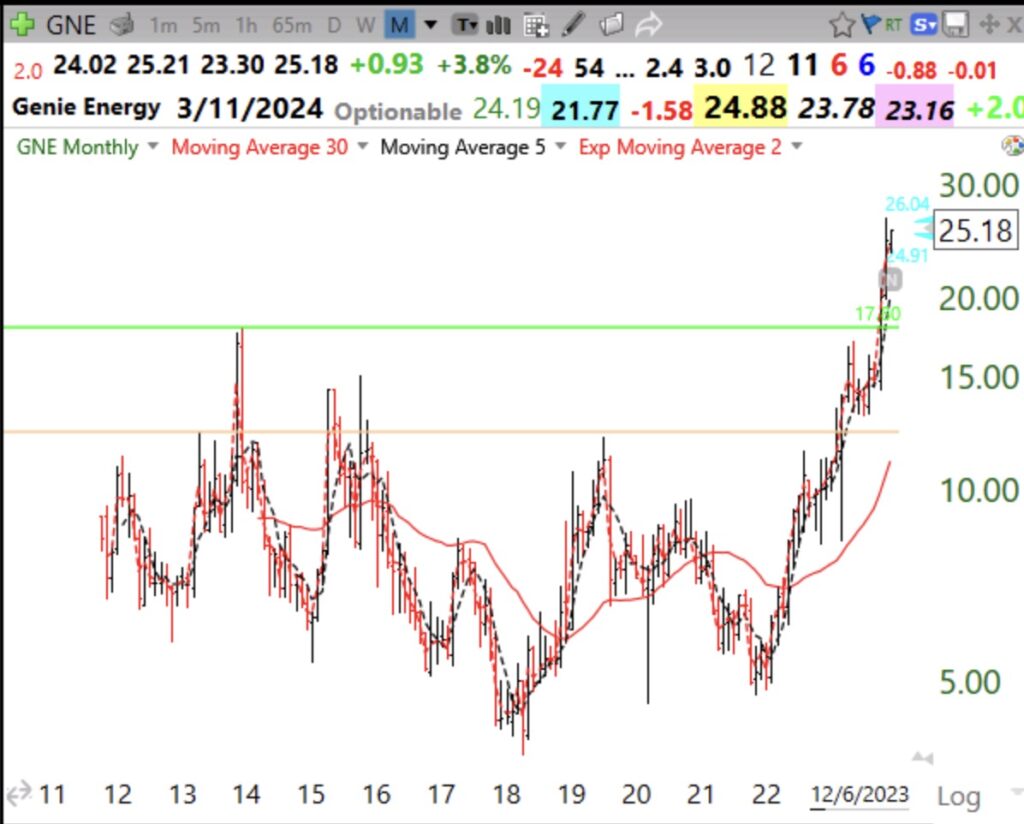
My weekly green bar setup looks for rising stocks that bounced up off of their rising 4wk average and reached a 20 week high in relative strength vs SPY. I buy them and place my stop just below the week’s low. They are sorted by current price/price 250 days ago. All of these are at least 1.9x their prices a year ago. Note that 3 of these are residential builders (MHO. PHM, TOL).
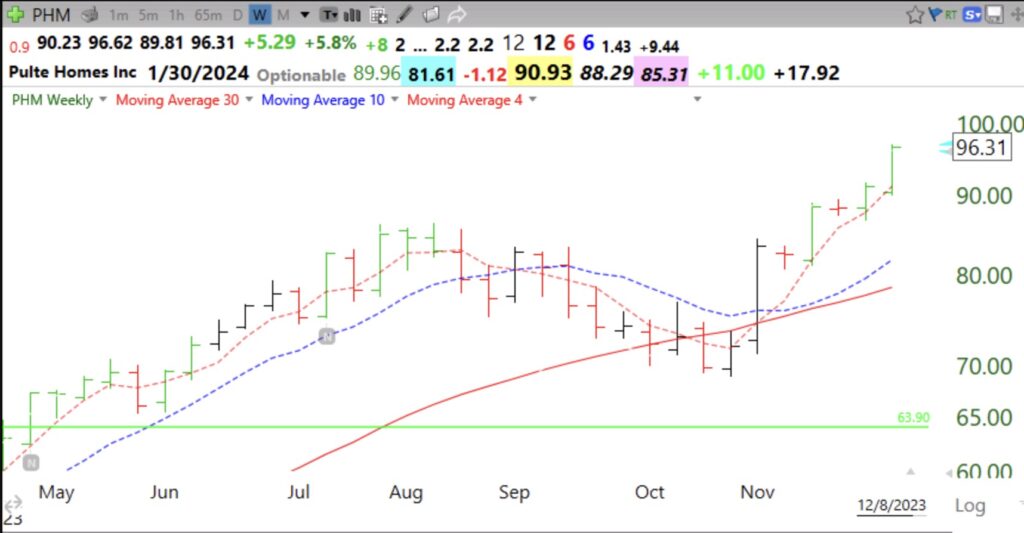
Note the weekly green bar on PHM, which is riding its 4 wk average higher (red dotted line). My GLB Tracker table, to the right, shows that PHM is up over 50% since its GLB last April.
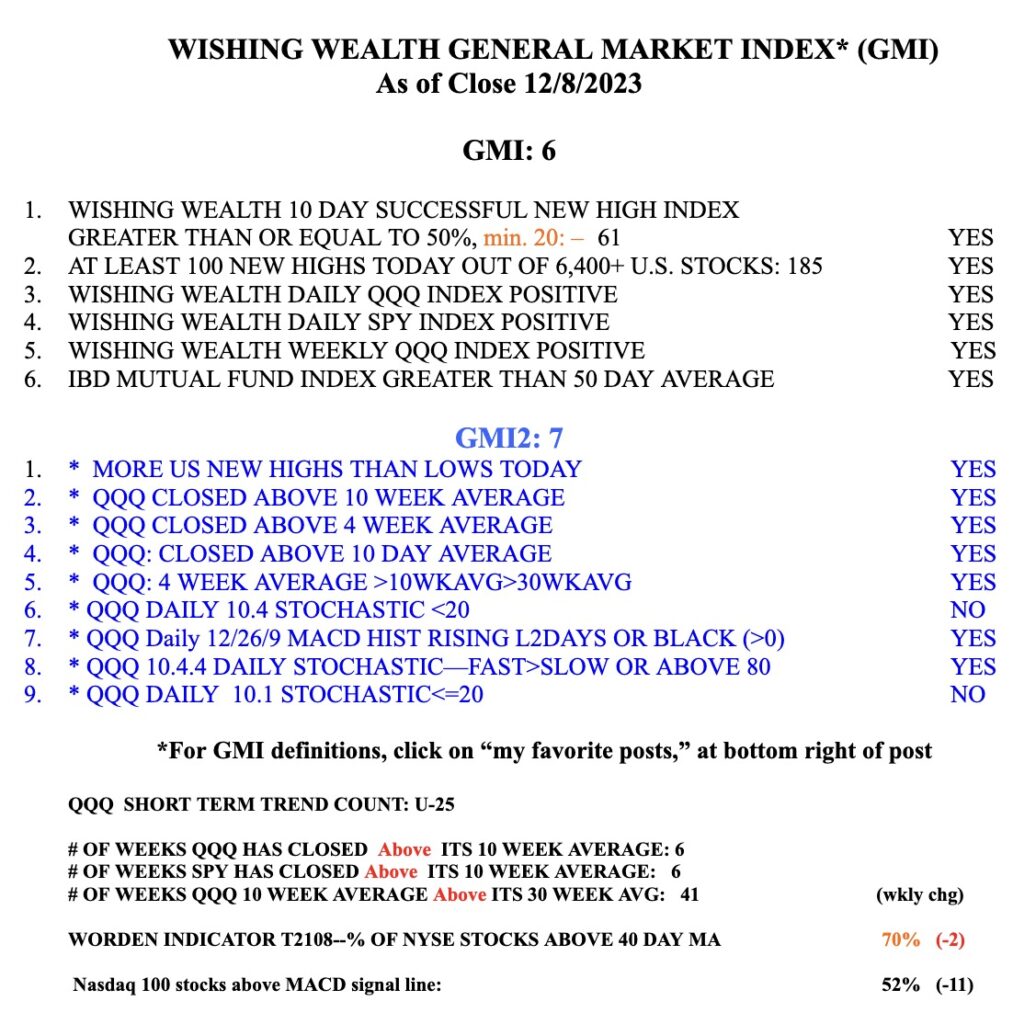
The GMI remains Green and is at 6 (of 6).
