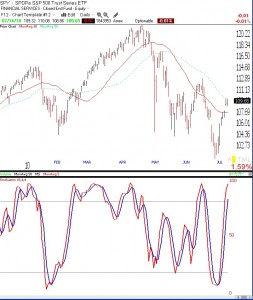
Wednesday was the first day of a new QQQQ up-trend by my definition. The GMI is now at 2. The more sensitive GMI-R is at 6, reflecting the strength of the short term up-trend. The QQQQ, SPY and DIA have yet to break through important longer term averages. The daily stochastic (10,4) for each index is in overbought territory: QQQQ (85), SPY (95) and DIA (97). Stocks and index ETF’s can stay overbought for a long time. The important point to remember, though, is that declines tend to begin from a stochastic reading above 80 and advances begin from a level below 20. Check out the daily chart below of the S&P500 ETF, SPY, and its stochastic below for an idea of how it works at tops and bottoms. (Click on chart to enlarge.) The other two index ETF’s look similar to SPY. At some point we will get the decline and the key to the trend will be where it bottoms out.
Market technicals split; overbought but GMI= 1
I have never seen a market so split like the current one. The QQQQ rallies for six consecutive days and rises 6.7%, even as the longer term technicals seem to remain in down-trends. Many of the stocks I follow now have a stochastic value above 80% and the Worden T2108 Indicator is now at 68%, close to overbought territory. Much of the market seems to be overbought even as the indexes remain below important moving averages. So, what to do? I will stand pat on the sidelines and wait to see if the indexes can push through these averages and begin a longer term up-trend. Failure to get through the resistance could lead to a significant decline. With the GMI at only one, I will not go long.
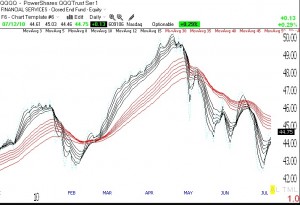
GMMA shows QQQQ still in down-trend
The daily Guppy Multiple Moving Average (GMMA) chart of the QQQQ below (click on chart to enlarge) shows that all of the short term averages (black) remain below the longer term averages (red). Monday was the 11th day of the current QQQQ short term down-trend.

