There were 792 new 52 week highs in my universe of 4,000 stocks on Tuesday, and 40 new lows. The long and short term trends remain up.
Up-trend reaches 11th day; XEC–cup with handle break-out?
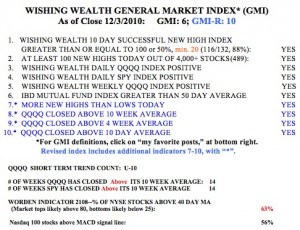
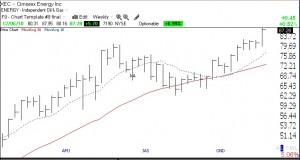
All of my indicators are positive, as the QQQQ short term up-trend completes its 11th day. With oil prices rising, oil stocks are hitting new highs. One stock at an all-time high that may have broken from a cup with handle base is XEC. See the weekly chart below (click on to enlarge). The “NA” on the chart shows when IBD wrote about XEC in their New America column of promising stocks.
IBD announces “resumed confirmed up-trend”, gives up on follow-through day; How mutual funds rip off investors; IBD100 list top 10 outperform indexes
I thought I would never see the day that IBD would switch from an outlook of “market in correction” to market in an up-turn without the required follow-through day on high volume. However, they say in Monday’s edition that the market has resumed its up-trend, “even if the classic sign of a bottom has eluded the major indexes.” This renewed up-trend, has caught a lot of people off guard, as it has come on a bunch of low volume days. Maybe IBD has decided that a high volume follow through day is no longer needed to confirm a new market rally…..
A reader wrote to me to that he pulled his money out of a mutual fund and the mutual fund family would not let him buy back into the fund. A lot of funds do not want people to get in and out of their shares and therefore have instituted restrictions against timing the market. So it isn’t bad enough that most mutual funds must stay fully invested during market declines. Now they are telling us that the individual investors must also ride their fund values down in a bear market. I do not trade my university pension mutual funds often, but when my indicators tell me that a big down-trend is likely, I move to cash. I therefore safely rode out the 2000-2002 and 2008 declines on the sidelines and my pension is now at all-time highs. There ought to be a law against the prohibition of market timing for mutual funds. The only good alternative right now is to get out of mutual funds and invest in suitable ETF’s. ETF’s have lower management fees too, so they are doubly good for the small investor……
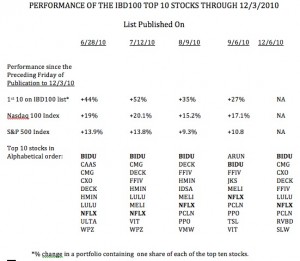
It is often fashionable for traders to denigrate the IBD 100 list of stocks published each Monday. The list contains the best stocks that fit IBD’s criteria for momentum growth stocks.  The stocks are presented in rank order. People often opine that the top ten stocks in the list have already risen too much and would be better traded as short candidates. I have created some watch lists in TC2007 for four top 10 lists published over the past few months. I decided to compare how a portfolio containing one share of each of these top ten stocks performed as a group versus the Nadaq 100 and S&P500 indexes after each list was published. This table (click on to enlarge) shows that the portfolio of the top 10 stocks beat these two indexes in each case. For example, the portfolio with the top 10 stocks on the list published on June 28, 2010, advanced +44% since the Friday before publication through this past Friday’s close. In comparison, the Nasdaq 100 index rose +19% and the S&P500 index +13.9% during the same period. Of note, BIDU and NFLX appeared in all four of these top 10 lists. If one had bought BIDU on June 25th and held it through last Friday, one would be up +53.5% and 57% for NFLX. So, maybe we should pay special attention to buying the top 10 stocks on the IBD100 list published on Monday, December 6. I will update the table in January….
The GMI and GMI-R remain at their maximum values. The SPY and QQQQ have now closed above their 10 week averages for 14 straight weeks.  On Friday, the new QQQQ short term up-trend completed its 10th day. More than one half (56%) of the Nasdaq 100 stocks closed with their MACD above its signal line, a sign of short term strength. I guess we will just have to ride this train until we get a definitive change in trend.
