Blog Post: Day 21 of $QQQ short term up-trend; Only 70 US stocks at new highs and 63 at new lows on Friday, 11 at ATH; see list of top 20 stocks that passed my weekly green bar scan and chart of $ACLS

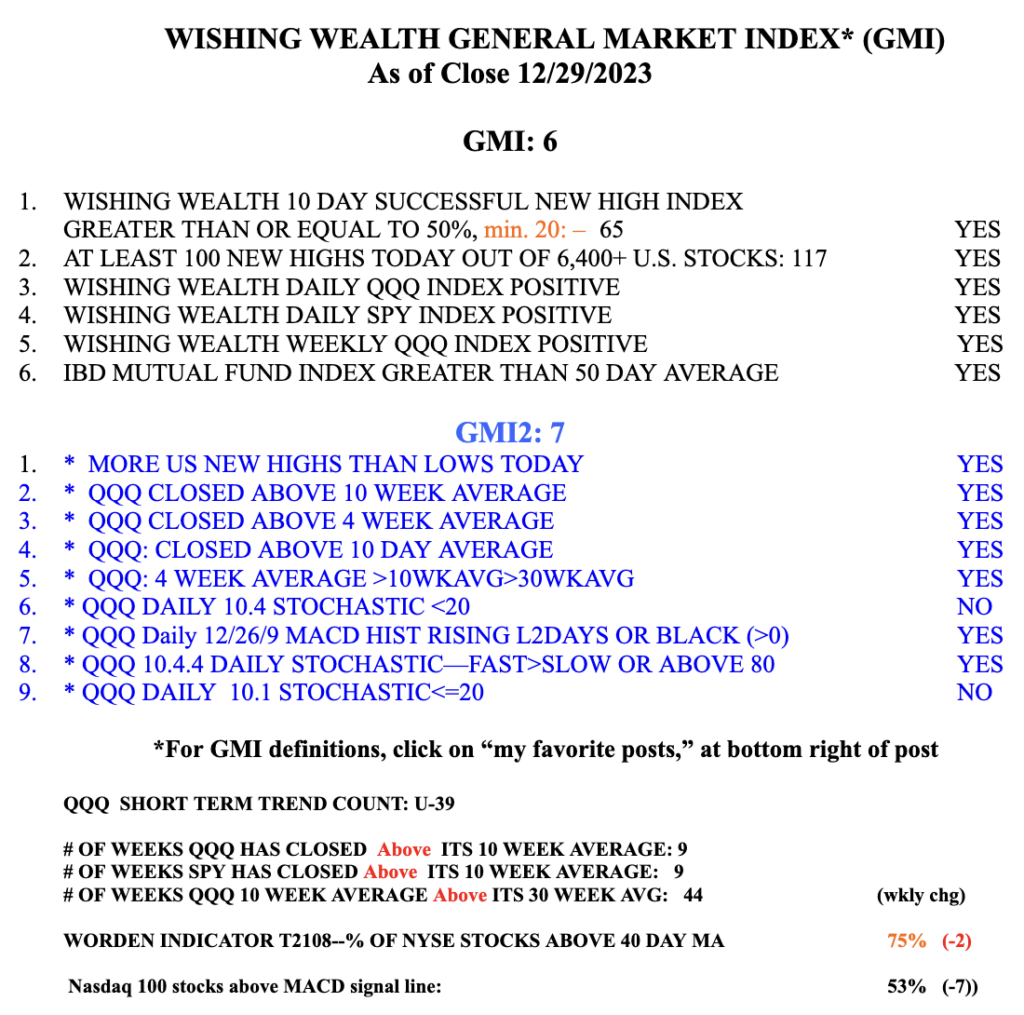
GMI5/6
GMI-24/9
T210871%

One of my favorite scans I created with TC2000 searches for a stock in a strong up-trend, at a  20 week high in relative strength vs. SPY,  that reached an ATH in the past 3 months and that has bounced up off of its rising 4 week average. If I buy one of these stocks I place my sell stop at the bottom of the weekly green bar, see the chart example of ACLS below this list. 29 stocks out of almost 7,000 passed this scan. I sorted the 29 by the amount each stock closed above its 250 day low (c/minl250, see last column). Here are the top 20. Seven of these stocks have at least doubled their low price. Stocks with a blue flag in the first column appear on my watchlist of recent IBD/MS stocks.


ACLS is an example of a weekly green bar stock. (I color green the weekly price bar all stocks that bounced up off of their 4 week average even if they did not survive all of the conditions in the scan.) Note how ACLS found support above its rising 4 week average (red dotted line) the  past 5 weeks. That is a pattern of a strongly advancing stock. A weekly close below the 4 week average would be the first sign of technical weakness and a warning that the rise may end. A weekly close below the 10 week average (blue dotted line) would be a sign for me to completely exit, if I owned it. Note the rising weekly volume as the stock has climbed. Also note the green line break-out to an ATH last week. ACLS  also follows my yellow band rocket stock pattern. According to MarketSmith, ACLS has Composite and RS ratings = 98.  The technicals tells me what to look at and when to enter or exit, but the fundamentals must also be strong.


The GMI remains at 5 (of 6) and on a Green signal. But note that my more short term and sensitive GMI2 components have weakened.


Blog Post: Day 17 of $QQQ short term up-trend; 5 “yellow band” stocks that hit an ATH on Monday, see the list and a chart of $BWMN

GMI5/6
GMI-26/9
T210876%

Those of you who have followed my blog or workshops (available at the tab on this blog) or have taken my course may remember the yellow band concept. These are advancing stocks that have closed each week above their 10 week averages for at least 10 consecutive weeks or more. The 10 week average is rising above the 30 week average so that one could draw a yellow band in the white space between them. These 5 stocks are yellow band stocks and reached an ATH on Monday. Only one, ALGM, is flagged, indicating its presence on my watchlist of stocks recently on a MS or IBD list. Three of them are already twice their low of the past year, see last column.

This weekly chart of BWMN illustrates the yellow band pattern. Note the recent GLB (green line break-out) and the many weekly green bars. In fact, BWMN has closed each week above its rising 4 week average (red dotted line) for 8 straight weeks, another sign of technical strength. I first wrote about BWMN after its GLB.