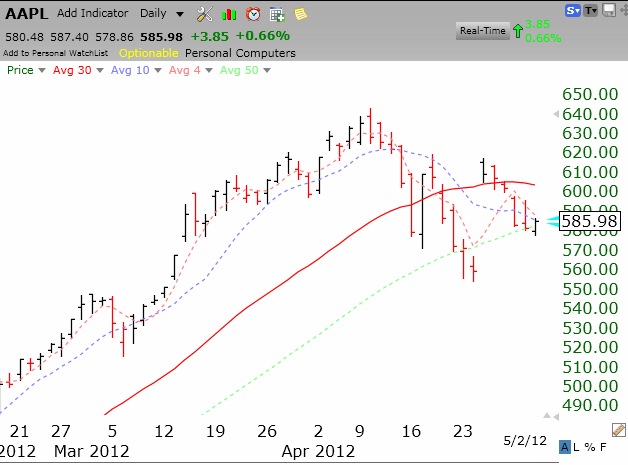
With the 30 day average of the QQQ remaining flat, I am only a little long in my trading accounts. Friday could be a volatile day, with the release of the jobs report and I am not taking many chances. I am also concerned that the market leader, AAPL, has stalled after releasing terrific earnings. Click on daily chart of AAPL to enlarge.