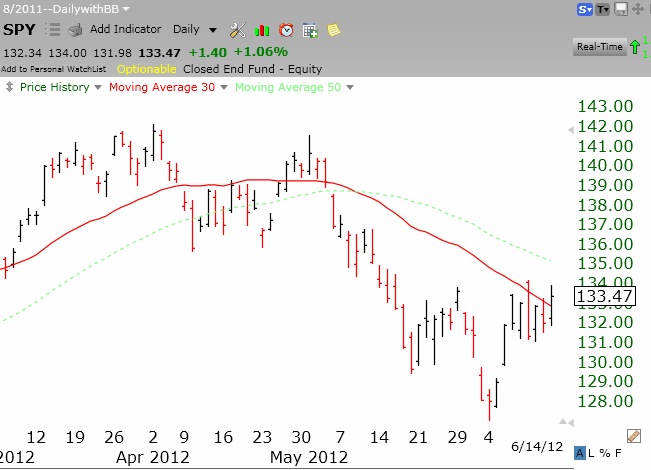
The market is showing some strength, reflected in the GMI’s rising to 3 (of 6). It is important not to cling to any market scenario, but to follow the trend signals. I am watching very carefully for signs that the short term down-trend is ending. It is very important, however, to react after the signal has occurred, and not in anticipation of one. The SPY has closed above its 30 day average for the first time since May 2nd. See the daily chart of the SPY below. The red line is the 30 day average. The DIA is above its 30 day average for the first time since May 3rd. These are major signs of strength for me. Only the QQQ remains below its 30 day, suggesting that tech stocks are lagging the financials and big caps—-for now. However, 82% of the Nasdaq 100 stocks closed with their MACD above its signal line, the highest percentage since last January! This is a sign of short term strength in the Nasdaq 100 stocks. Just when the news about Europe seems to get worse, the market appears to resist going down. However, IBD still considers the market to be in a correction. If the QQQ short term trend should turn up next week, I will start buying QLD.