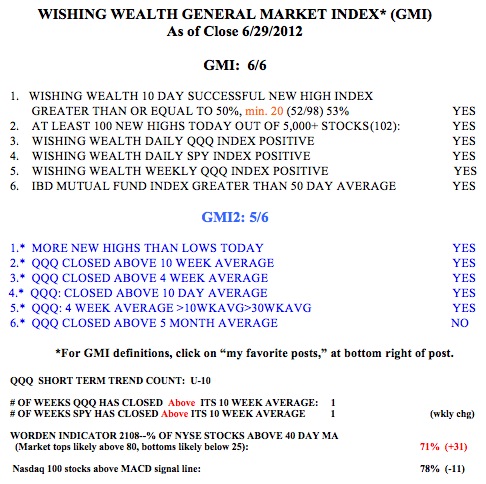
Well, the expected window dressing came, but on the last day of the month! Now we get to see if the market can continue to climb or if it will go into a pre-earnings release lull. I suspect it will be the latter. There were 339 new highs on Friday in my list of 5,861 stocks. This was the highest number of new highs since March 26. The Worden T2108 is at 71%, still in neutral territory. I do not begin to worry about too much exuberance in the market until the T2108 reaches 80%. This market remains in a Weinstein Stage 2 up-trend. IBD now sees the market in a confirmed up-trend and the GMI Buy signal remains in effect. I will therefore gradually add to my long positions.
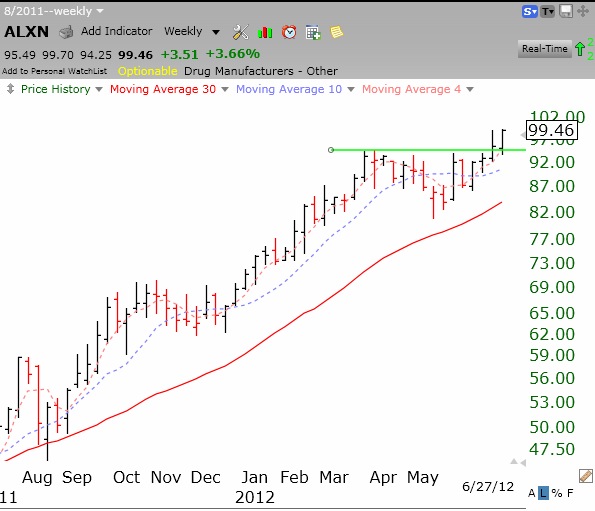
22 stocks showed up in my Darvas Scan. They are, in alphabetical order: ABAX,ABCO,ALXN,ASPS,CSTR,CYBX,DG,GEOI, IOC,ITIC,LL,QCOR,SHW,
SIX,SLXP,SUSS,SXCI,TCBI,TDG,ULTA,ULTI,ZUMZ.
14 of these 22 stocks are in my IBD50, CAN SLIM, or New America watchlists. All of these stocks passed my technical criteria and have good fundamentals. They are worth researching for possible buys………
This weekend the DC area was hit with a sudden fierce storm that brought down electrical power for over 500,000 people. The storm slowed everything down with many traffic lights not working. I was unable to spend as much time as usual on this blog. However, with a shortened holiday week upon us I hope to write more later this week.