If the QQQ stays level or rises on Friday my short term trend count will turn up again. I remain fully invested in mutual funds in my pension account and am mainly in cash in my IRA and margin account. If the up-trend resumes I will buy some QLD. The Worden T2108 is 71%, in neutral territory.
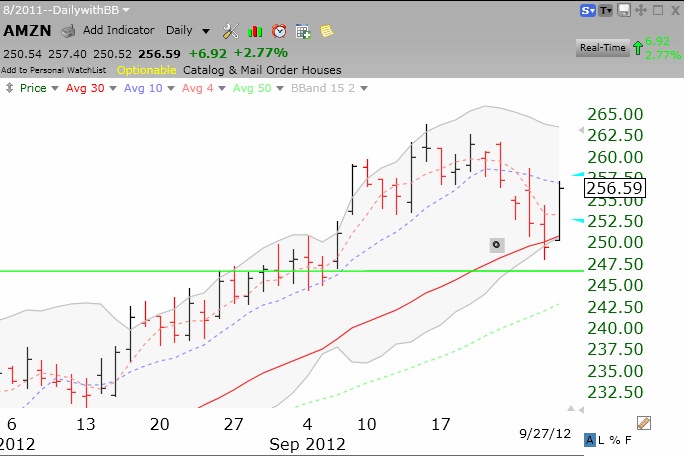
I bought some AMZN on Thursday when the stock regained its 30 day average (red solid line) after an oversold 10.4 daily stochastics reading (not shown). I will exit the position if AMZN comes back below this critical average. Note the green line showing that the stock is in it top box above its latest base at an all-time high. I am looking for a rise to the top of its Bollinger band, around $263.