Friday was the 18th day of the QQQ short term down-trend. AAPL is a good metaphor for the tech market. It is a broken stock, for now. Most people have no rules for exiting a stock and just ride a winner up and back down. On October 8, with AAPL at 652, I wrote that the stock had closed below its critical 10 week average. My sell rule with AAPL and most growth stocks is never to hold it when it closes below its 10 week average. This rule has worked repeatedly for me with AAPL. When AAPL reclaims its 10 week average (now about 647) I will consider reentering this stock. I never marry a stock. As the perspicacious William O’Neil of IBD says, all stocks are bad unless they are going up.
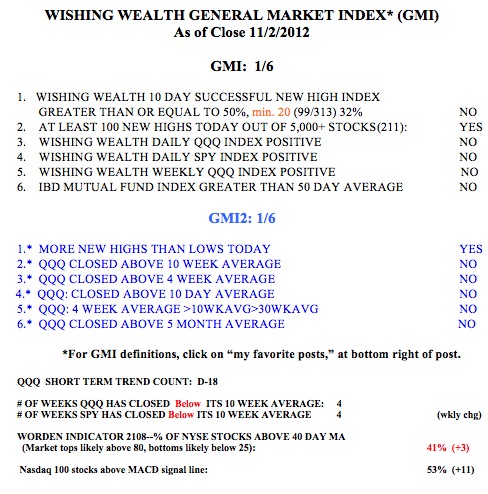
With the GMI at 1 and in a sell signal since October 22, I remain in cash or short in my trading accounts. I remain fully invested in mutual funds in my university pension. I like to short the indexes with the triple (3X) inverse ETF’s, SQQQ (a bearish derivative of QQQ) and SPXS (S&P 500). With 3X inverse ETF’s I buy in slowly and only add more to my position if the ETF rises. I never average down, which amounts to placing a larger bet after the first one was wrong. With 3X ETF’s which can decline fast, it is critical for me to have an exit plan for each position.