The GMI stayed at 5 on Thursday and switched to a Buy mode. This is because the GMI closed for the second day above 3. Thursday was the 3rd day of the new QQQ short term up-trend. I am slowly adding to TQQQ. If the new up-trend lasts through Monday, its 5th day, I will accumulate more TQQQ.
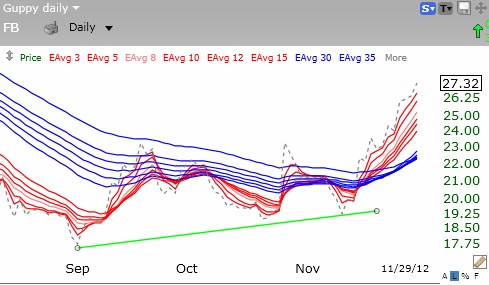
Meanwhile, FB continues to climb, up another 3.6% on Thursday. This daily Guppy GMMA chart shows that all of the shorter term averages (red) are now rising above the longer term averages (blue).