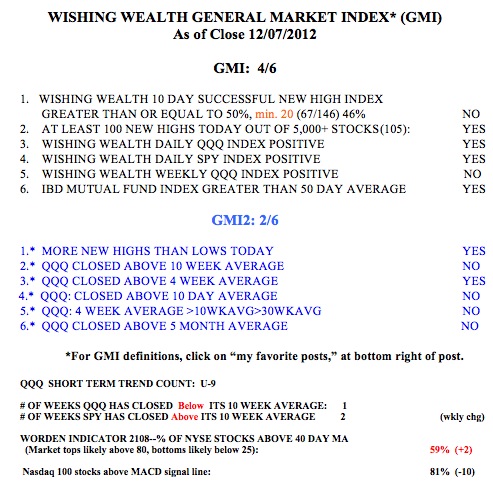
The QQQ and SPY have diverged. The QQQ is now below its 10 week average and the SPY completed its second week above it. The tech index ETF is, perhaps, only reflecting the weakness in AAPL. We shall see. The GMI buy signal remains in place. The weakness in the more sensitive GMI-2 suggests that this up-trend is vulnerable. I am still holding a position in TQQQ, but will exit if the short term up-trend should end.
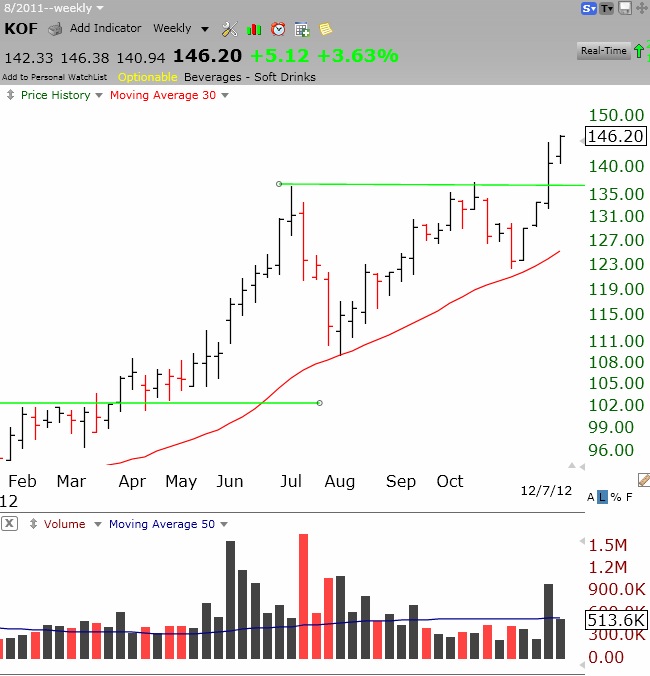
During weak markets I like to scan the new high list for stocks with good technicals and fundamentals. KOF came up this weekend in my TC2000 scan. It looks like KOF has had a large volume classic break-out from a cup and handle base. Take a look at this weekly chart of KOF. It was also a green line break-out, meaning it broke from a multi-month base to an all-time high. KOF may be worth researching, but a lot of break-outs can fail in a weak market environment. In 1995, KOF sold for as low as $4.29 per share and is now around $146. In the decline in 2009, KOF bottomed around $26. How did I miss this one?!