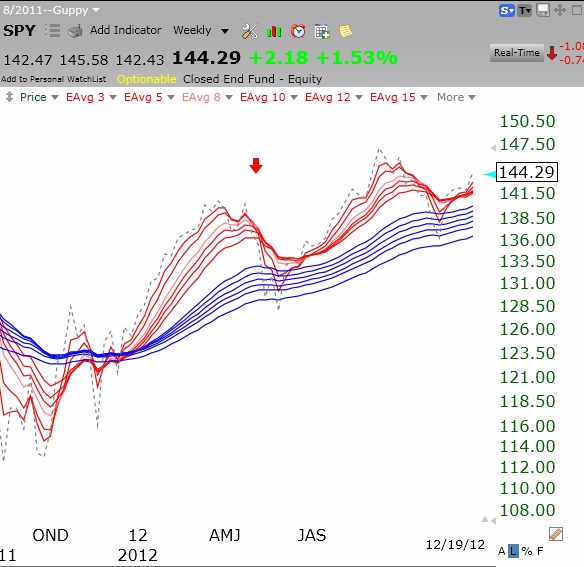
On Thursday, I bought some January call options on the bearish leveraged ETF, SQQQ to hedge my long position in the bullish leveraged ETF, TQQQ. With the news that “Plan B” has failed, the index futures look very weak. My hedged position should reduce any losses resulting from a decline in TQQQ. I hope my readers have also been only cautiously bullish……..
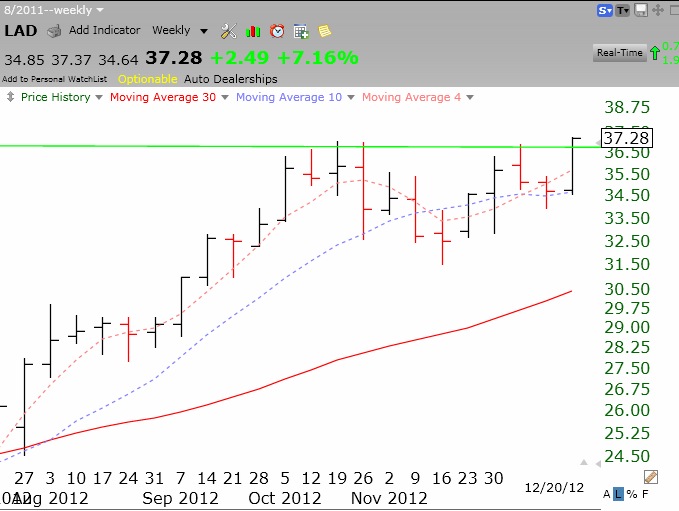
While I would not buy any individual stocks right now, one of the 16 stocks to come up in my TC2000, New High with Good Fundamentals Scan, Thursday night was LAD. It turns out that LAD hit an all-time green-line high on Thursday. This a a break-out above the high reached in 2006. Any stock that can come through a tough market like this and go to a new all-time high is worth researching. The weekly chart below suggests to me that this a a cup-with-handle break-out.
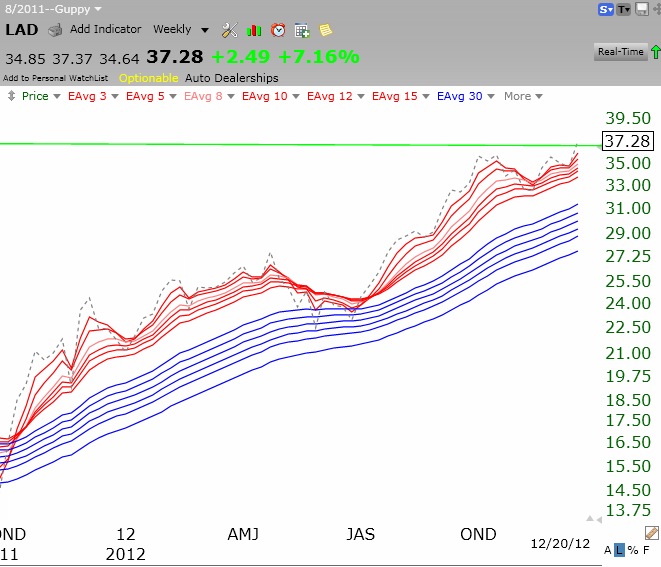
The weekly Guppy chart below also shows LAD to have an RWB rocket stock pattern. Click here to read this interesting article about LAD.
If you want to learn more about how I analyze stocks, see my free Worden sponsored Houston TC2000 webinar by clicking here.