Another strong day; GMI: +6 and its track record; Benefits of naked charts; Some Darvas type stocks

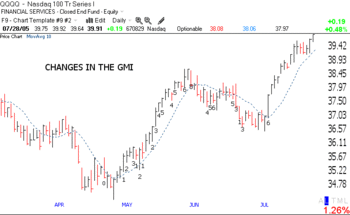
Another strong day. There were 522 new highs and only 15 new lows.  61% of the Nasdaq 100 stocks, 76% of the S&P 500 and 83% of the Dow 30 stocks advanced today.  Yes, even the Dow stocks are finally moving up.  The GMI remains at +6 and has been so since this uptrend began on July 8.  Gmichanges728 The chart (click on it to enlarge) shows the changes that have occurred in the GMI since I began posting it in April.  Note that the GMI registered a maximum +6 on July 8 when the QQQQ closed at 37.77.  In this rise as in the prior May rally the QQQQ consistently closed above its rising 10 day moving average (the dotted line).  Since July 8 the QQQQ has closed above its 10 day every day.  Hint: When is the market weakening? Wait for a close below the dotted line.  To make $$$ in this rise one merely could have bought the QQQQ on July 8 or 9 and held on.  Aggressive traders could have bought call options on the QQQQ and made a killing.  Why mess around with individual stocks when one can merely trade this index? Until the 10 day average tops out, I see no reason not to be long Nasdaq 100 type stocks.  As I said weeks ago, if the train is moving in the direction I want to go, I don’t argue with it–hop on.  I can always jump off when it changes direction.  I ignore the economy and the machinations of the pundits and economists—I just follow the dotted line……………………..
Speaking of dotted lines.  I am now going to show you a most unorthodox "Naked Chart.Googunorthodox" This
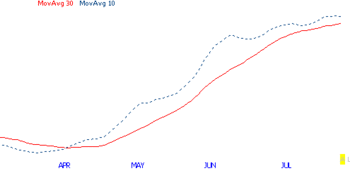
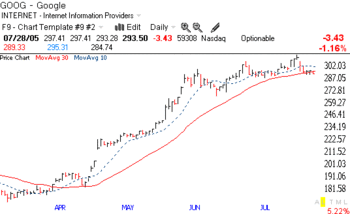
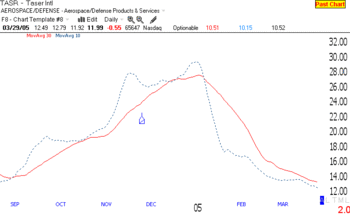
chart contains 2 moving averages without the daily prices.  The dotted line is the 10 day average and the red line is the 30 day average.  Now it does not take a rocket scientist to see that one could have made a handsome profit by buying when the dotted blue line crossed above the red line. One might even say that the prices obscure the trend.  The trend is sure apparent here, isn’t it?  Fortunately, TC2005 allows me to make any indicator invisible while letting the data be used in the chart.  Do you think you might have been able to hang on to this stock and not be shaken out?  Can you guess what stock this is?  Take a look below.  It’s our friend, GOOG!  Note how the chart with the prices visible actually obscures the pattern of the moving averages.   Goog728 Maybe we could all trade more calmly if we just focused on the two moving averages in Naked Charts.  Even if we can’t avoid looking at the prices, one rule that could be taken from this exercise is to only go long stocks when their 10 day average is above their rising 30 day average.  In case you think this technique only works well for GOOG, take a look at this past winner.  TASR topped out in early 2005 around 33 after doubling in about 4 months.  Here is what the daily 2 average Naked Chart looks like.  Tasr728 Can you see the sell signal at the top?…………………………..
I told you before that the great Nicolas Darvas (see his books listed at right) looked for stocks hitting new highs that have doubled in the past year.  Here is a list of stocks that hit new highs today, doubled in the past year and had triple digit increases in earnings in the most recent quarter listed by TC2005:  NPSN,ATPG,CNXS,ISRG,TZIX,PLCC,TS,NTRI,HP,SWB,FORD,ATRO,USAK,LAN,

POT,JLG,LIFC,HOLX,BTJ,BTU.  This would be an excellent watchlist to research to find the next big market winner–as long as the GMI holds up.

I introduced some new ideas tonight.  I would greatly appreciate your comments.  Please send me your feedback at: silentknight@wishingwealthblog.com.
A hot market; GMI: +6; more rockets; covered calls on GOOG

To my visitors: I am only one trader, not a guru, and not a financial advisor.  I am presenting my own opinions and my own experiences and people are welcome to decide for themselves what, if anything, on this site is of value to them.  Please refer to the additional comments, highlighted in red, at the end of this post.

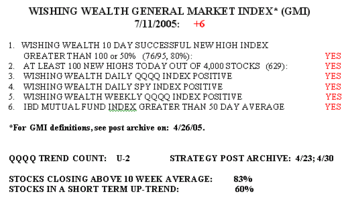
This is one hot market!  There were 629 new highs (16%) in my universe of 4,000 stocks today.  Gmi711 The GMI remains at +6 and 83% of the stocks closed above their 10 week averages.  I changed the criterion for the 10 day new high index to be positive if there were 100 successful stocks or at least 50% of the stocks that hit a new high 10 days ago closed higher today than 10 days ago.  There were only 95 new highs 10 days ago, so the indicator would have had to be negative (less than 100) the way I originally defined the index.  So today, 76/95 stocks or 80% qualified as successful 10 day new highs.  60% of the Nasdaq 100 stocks are in a short term up trend and 73% to 78% of the Nasdaq 100, S&P 500 and Dow 30 stocks rose today.   These advancing percentages are lower than yesterday’s, but still very respectable……………………………………………

I received a lot of nice reader feedback today–thank you!!  I will address many of the issues you raised, in coming weeks………………………………………

I found a really neat description of a market scan used by a successful newsletter, Coolcat.  Many of the stocks listed are those I have spotted.  Note this scan for finding great microcaps uses some of the types of technical criteria I (and Nicolas Darvas)  use to define rockets–new highs and huge price appreciation.  As I wrote in my strategy posts on 4/23 and 4/30 (check the archive), to find a stock that will double, find one that has already doubled.

My rocket scan found loads of promising stocks today.  All of these had triple digit earnings increases last quarter and are at new price peaks:  CNXS, LUB, BOOM, NDAQ, TS, NTRI, BMHC,  CPSI, LUFK, HANS, RIV, KOSP, SPTN, RTI, TU, PTRY, SNHY, HOLX, SE, WCG, TUG, PCO, VDSI, BEBE, SMTS.  Check them out.  When I buy strong momentum stocks like this, I make a small pilot buy and put a stop loss order in below support or below a moving average where it has found support.  I then wait to see if it moves up and I slowly add more on the way up, as long as the GMI is strong……………………………..

Ever write a covered call in your IRA account?  Today, I bought 100 shares of GOOG at 295.74.  I then immediately sold a call for someone to buy my 100 shares from me at 300 per share, good through expiration on August 19.  In return for the right to buy my GOOG from me at 300 during this period I was paid 15.80 per share, or $1580.  What this means is that by option expiration in August, if GOOG is selling above $300, the option will be exercised and the stock will be called away from me for $300 per share.  My profit (excluding commissions would be 30,000-29,574= +426 + 1580= $2006 or 7% in about 6 weeks.  I am giving up the right to make anymore than this no matter how much above 300 that GOOG may climb during this period.  On the other hand, if GOOG should decline during this period I would not have a loss until it fell to 279.94 (295.74-15.80).  The option premium of 15.84 per share is mine to keep and protects me from a loss on my purchase down to 279.94.  As long as GOOG closes above 279.94 by the August expiration I will have a profit.  If GOOG closes below $300 in August, the option expires worthless and I can write a new call on the same shares for September or later. If the stock falls a lot more than 15.80, I could have a large loss.

Covered call writing is really a very conservative strategy.  I only sell calls on stocks that I think will rise and which are so volatile that the option premium (amount someone will pay me for the option) is considerable.  I do not want to buy GOOG without the protection of the covered call, so I do not care if the stock goes way above 300 by August.  Check out covered call writing in the CBOE learning center.  Many people of the "buy and hold" mentality could have limited their losses in 2000-2002 if they simply had written calls on their stocks as they declined. If you use a full service broker and s/he did not tell you about covered calls as your portfolio shrunk, you should liquidate your broker instead of your account.

Send me your feedback at: silentknight@wishingwealthblog.com.
Please remember that the stock market is a risky place, especially now.  I am not providing recommendations for you to follow.  My goal is to share tools and methods that I have used over the past 40 years of trading, so that you may learn from them and adapt them to your trading style and needs.  While I do my best, I do not guarantee the accuracy of any statistics computed or any resources linked to my blog.  Please consult with your financial adviser and a mental health practitioner before you enter the stock market,  and please do not take unaffordable risks in the current market environment.  See the About section for more statements designed to protect you (and me) as you navigate this market. Past performance does not guarantee future results, but I would rather learn from a former winner than a loser.

Darvas’ stock market casino, fabricated fantasy, interest rates resume rise, a new trend count; GMI: +5

"It means, as I see it, that the corporation gets the money it needs, absolutely free and clear of any obligation to repay it–ever.  The underwriters get their cut or commission (or both) for placing the stock issue.  The stockbrokers who handle all subsequent transactions in the stock get their commission.  And the public will get "shares" (i.e., chips) with which to gamble–the gamble being, of course, that someone else will pay you a profit on them in the hope of selling them to a third person for a little bit more , and so on in an endless cycle of speculation.  This is, in essence, the entire story of the stock market, as I have found it."

Nicolas Darvas, Wall Street: The Other Las Vegas, Kensington Publishing, 1964, p. 54-55.

I read Darvas’ books in the 1960’s and they had and continue to have a profound impact on my approach to the market.  I know that William O’Neil and some of his colleagues have also referred to Darvas’ influence on their trading strategies.  Here is a man, Darvas, who made almost 2 million dollars in the stock market in 18 months while he danced around the world, subsequently saying that the stock market was just a venue for gambling.

After the internet bubble and the tech stocks collapsed so badly in 2000-02, I think many of the people who were so badly burned, would agree with Darvas.  Nevertheless, there persists an entire industry of people who attempt to make the market seem rational and spend lots of time analyzing the "true value" of stocks.  What if Darvas is right?  All of these people and institutions who are paid millions of dollars for their financial advice are simply involved in a world of fabricated fantasy.  If Darvas is right, the idea of having people trusting their economic futures (and social security) to the whims of the great stock market casino terrifies me. As Darvas says at the end his book, "I walk into the Casino with my eyes open as I would if I were walking into a Casino in Las Vegas.  I ignore the chatter, I watch the action; and, I try my luck."  I believe that this is our mission as market technicians. ……………………………………….

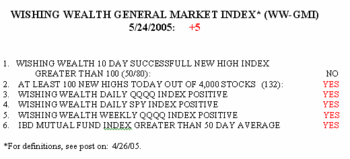
The GMI held at +5 today.  The market has weakened some, Gmi524 however, with only 132 new 52 week highs, down from 197 new highs on 5/18.  There were 28 new lows in my universe of almost 4,000 stocks.  Successful 10 day new highs were 50 today, down from 84 on 5/19.  Only 46% of the Nasdaq 100 stocks rose today, 41% of the S&P 500 stocks and 43% of the Dow 30.  Put another way, the majority of the stocks in these indexes declined or were unchanged today.  This rally may be taking a breather.  Note that the GMI is explained in my post on 4/26.

As long as the GMI stays at +5, I feel comfortable holding stocks and buying stocks that bounce off of support levels.  I am not as confident of buying new highs right now, however. Some of my stocks hit new highs today but closed near their lows of the day (GOOG, BOOM).

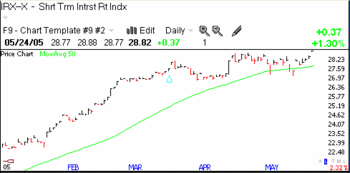
There is one big negative that I see.  The short term interestIrx524_1 rate index went to a new high today (click on figure to enlarge). Speculators are again betting on more Fed rate hikes and this could eventually torpedo the market.  If it does, the weakness will show up in the GMI.  Nevertheless, the resumption of the rise in this index just makes me a little more cautious about the possible longevity of this bull move…………………………………………….

I am introducing today another indicator I find useful.  I simply count the days since the current trend began.  Today is day 13 of the rally, as I define its inception.   I will use the term U-13 (for today’s count) to designate the duration of an uptrend. A downtrend will be indicated by D-xxx.  This indicator will help us to monitor the maturity of a trend.  At some point I will show you an analysis I did of the duration of up and down trends over the past few years.  It helps me to determine how likely it is that a trend will continue. In future posts I will include this trend count in the GMI indicator box.

Send me your feedback at silentknight@wishingwealthblog.com

Please remember that the stock market is a risky place, especially now.  I am not providing recommendations for you to follow.  My goal is to share tools and methods that I have used over the past 40 years of trading, so that you may learn from them and adapt them to your trading style and needs.  While I do my best, I do not guarantee the accuracy of any statistics computed or any resources linked to my blog.  Please consult with your financial adviser and a mental health practitioner before you enter the stock market,  and please do not take unaffordable risks in the current market environment.  See the About section for more statements designed to protect you (and me) as you navigate this market. Past performance does not guarantee future results, but I would rather learn from a former winner than a loser.