If one can ride a sustained up-trend in the QQQ with TQQQ, it is possible to beat almost all other stocks. From day one of the QQQ short term up-trend that I announced on 4/28, TQQQ has advanced 29.6%. Only six of the Nasdaq 100 stocks did better. See this list, ranked by performance from 4/28 through Friday’s close. Did you buy any of them on 4/28?
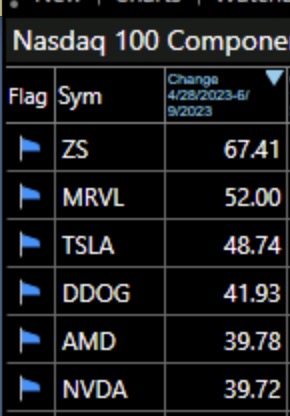
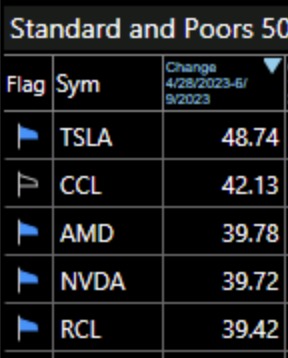
If you could have successfully picked these 6 stocks on 4/28, then just ignore this strategy and maybe tell the rest of us how you do it. For most mortals, however, it is much easier to just buy TQQQ than to try to find the needle in the haystack that will outperform it. TQQQ also advanced more than all but 5 of the S&P500 stocks, shown below. In other words, TQQQ outperformed 99% of the S&P 500 stocks. I looked at my Market Smith Growth 250 watchlist from 4/13/2023, the watchlist closest to 4/28 that I have, and found that TQQQ even beat more than 90% of those promising stocks.
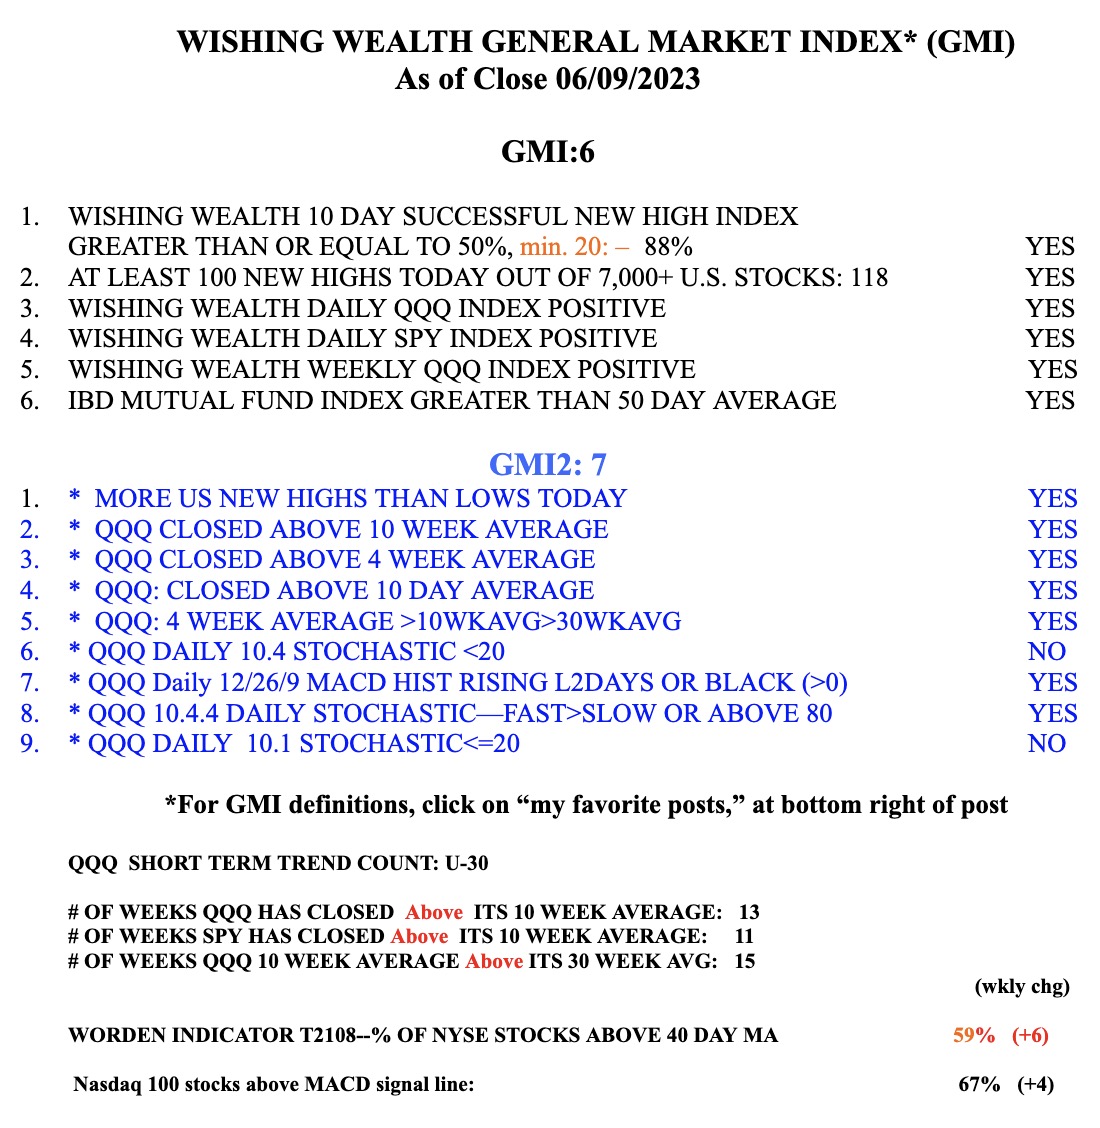
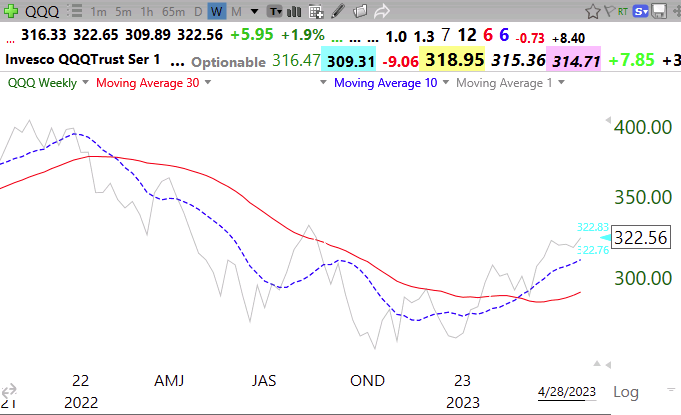
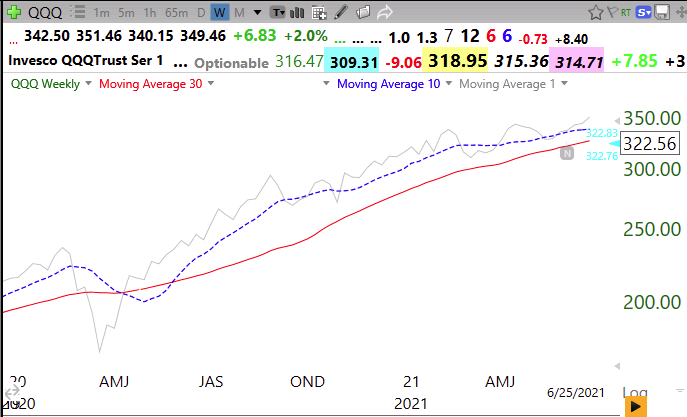
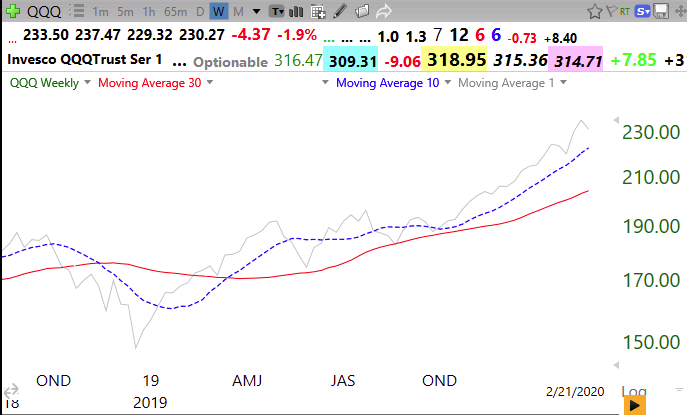
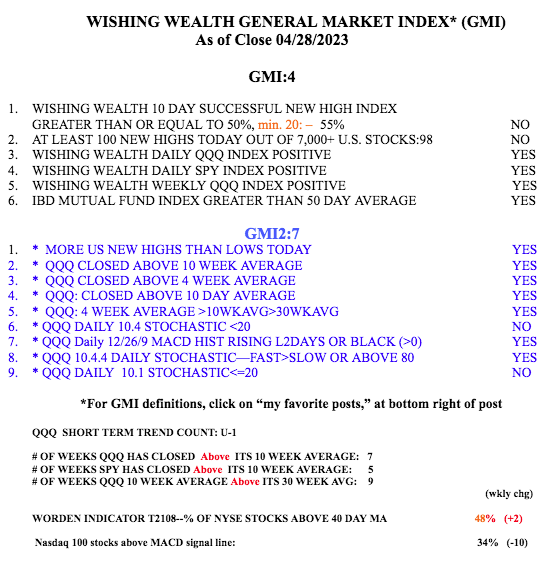
The moral of the story is this. Buy TQQQ instead of trying to predict in advance the small percentage of stocks that will beat it. Please keep in mind that TQQQ is triple leveraged and moves 3x as fast as QQQ, up or down. So one must have a valid indicator of the short term trend and know when to exit. I post my QQQ short term trend count almost every time I publish my blog and weekly in the GMI table below. (You can sign up to get my blog post by email, lower on this page.) This strategy has worked best if one buys TQQQ on Day one of a new short term up-trend and then pyramid up slowly. This is difficult to do psychologically because on Day one, by definition, the market trend is reversing from a down trend and it is often hard to believe a real change is occurring. The key is to start small on Day one and only add more TQQQ as the up-trend develops. If the new up-trend fails, I exit immediately. The media pundits who decry the triple leveraged ETFs just do not understand how well they work in sustained moves. SOXL advanced 57% during this period! While my TQQQ strategy has worked many times, past performance does not guarantee future performance, and be careful.
The GMI remains Green and is at 6 (of 6). I have been reinvesting my pension funds in mutual funds. At some point many of the people who withdrew from stocks in order to earn a “safe” 5% in their savings accounts will panic and race back into stocks at higher prices, when yields decline. So goes the game…..