I know all of us would like to identify a break-out stock like TSLA before it doubles. Did TSLA give itself away before its break-out? I believe the methods I have been demonstrating show how it would be possible to detect such an explosive move in advance. So, let’s do it.
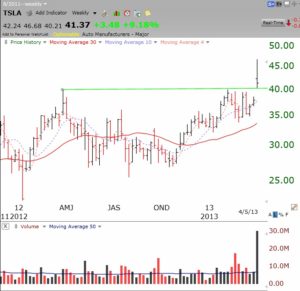
First, I have been saying that to find a winner, one must look for stocks hitting new highs. So, we run a scan of stocks hitting new highs on the evening of April 1, 2013 and TSLA comes up. I immediately look at a monthly chart and find that TSLA is a green line break-out to an all-time high. I see that On April 1, 2013 TSLA closed at 43.93, well above its former peak price of 39.95 reached a year earlier in March, 2012. This current monthly chart shows where the green line might have been drawn on or before April 1, at its prior 2012 peak .
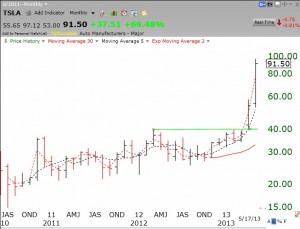
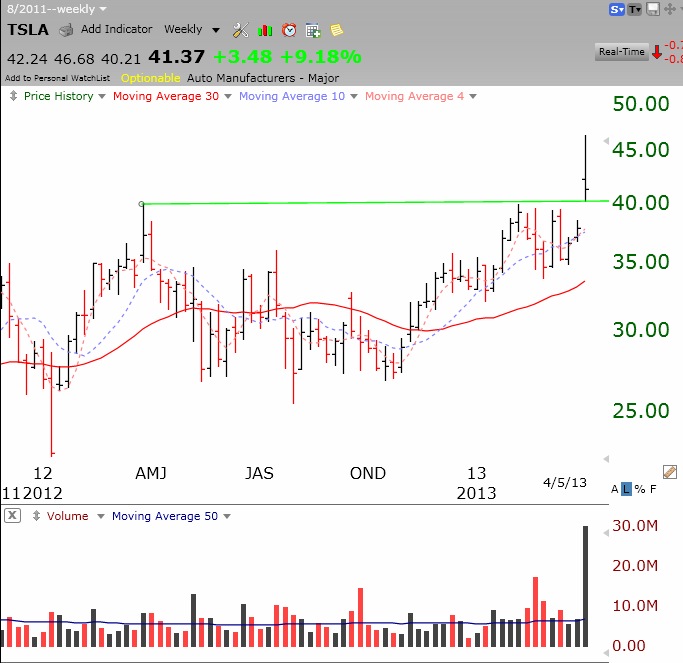
So the night of April 1, with TSLA at an all-time high, I would have immediately looked at its weekly chart. (This chart is as of the end of the week TSLA broke out.)
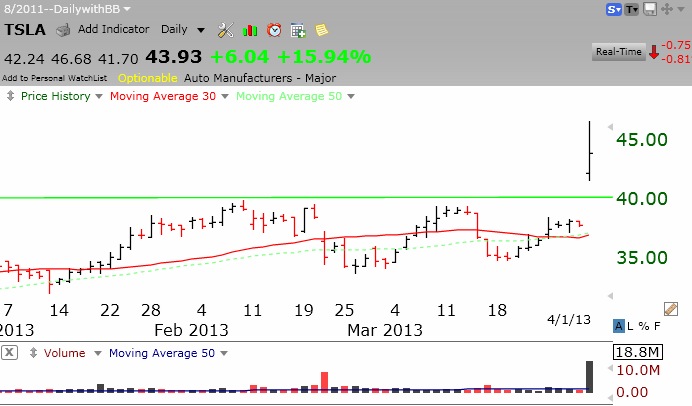
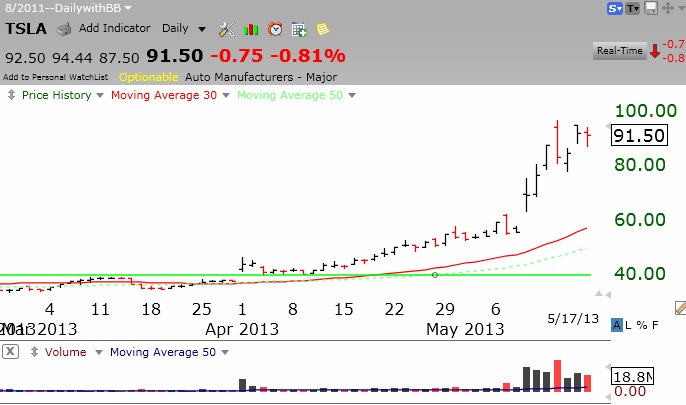
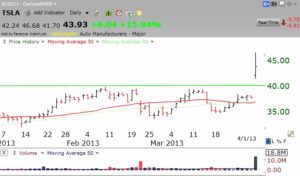
Note the volume spike at the bottom. The stock broke to an all-time high on the highest weekly volume ever. This might also be a cup and handle break-out. Now here is the daily chart at the close of April 1.
Note the gap above the green line top on huge daily volume. Not all green line break-outs work out. Sometimes they fail and/or retest the green line and then take off. If we had researched TSLA we may have decided it was worth at least a small purchase, given it is a recent IPO in a new growth industry–battery powered cars. One might buy a little and see if the stock continued its advance or wait for it to re-test the break-out.
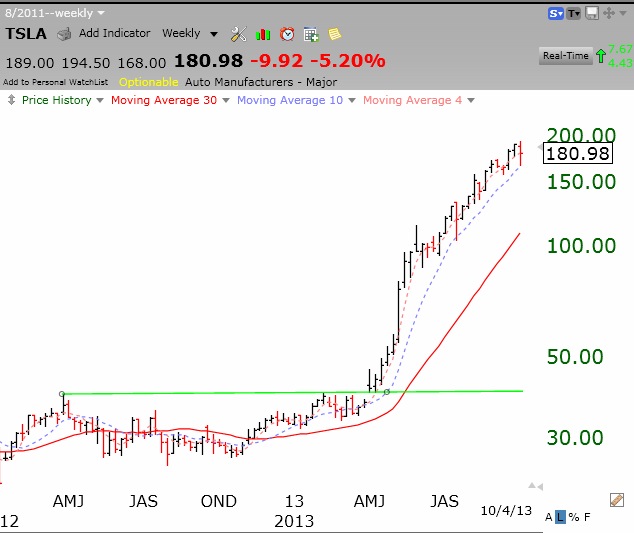
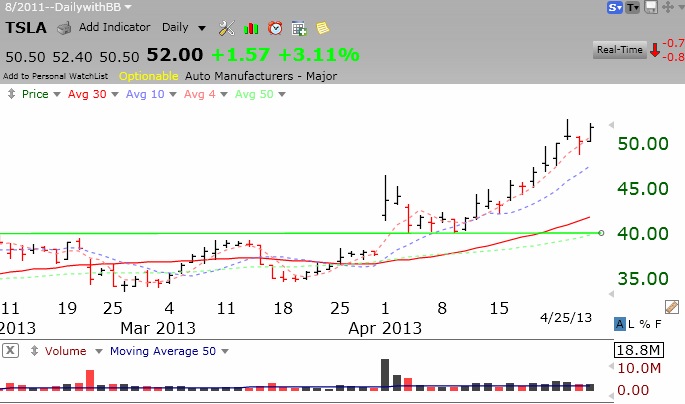
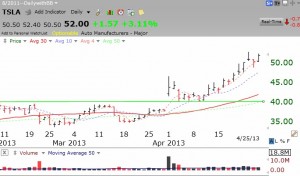 It turns out that TSLA did re-test its break-put, giving one an opportunity to buy it at the successful re-test. The rest is history.
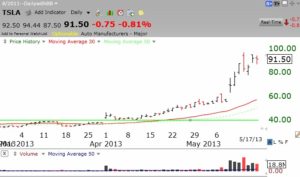
With TSLA now at 91.50, don’t say that the stock did not give us trade-able signs of this advance before it took off. We just must know what signs to look for and to heed them.
Given that we are in a strong up-trending market, we can still look for new explosive stocks like TSLA. We can be alerted to them by scanning the nightly new high list. Then we must check to see if it is a green line break-out to an all-time high on above average volume. Then we can research it and decide whether it is in a growth industry that may excite people. Is it an IPO? The fact that TSLA had come public in the recent past was a plus because most funds would probably not already own it. Finally, we can buy it or watch for a re-test of the break-out and determine a buy point with minimal risk. (If the stock closes back below the green line we can sell with a small loss.)
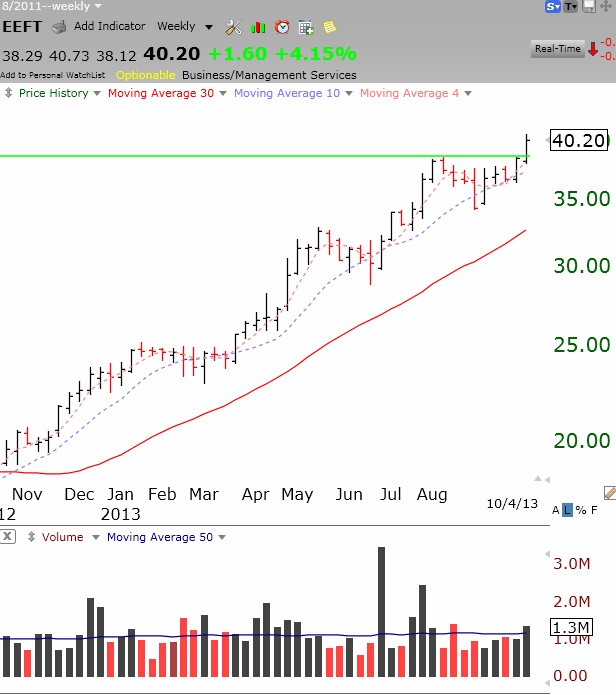
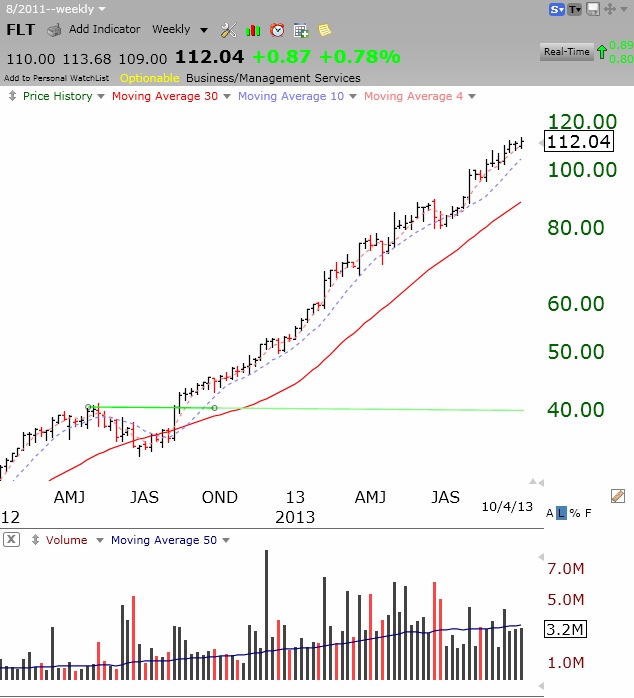
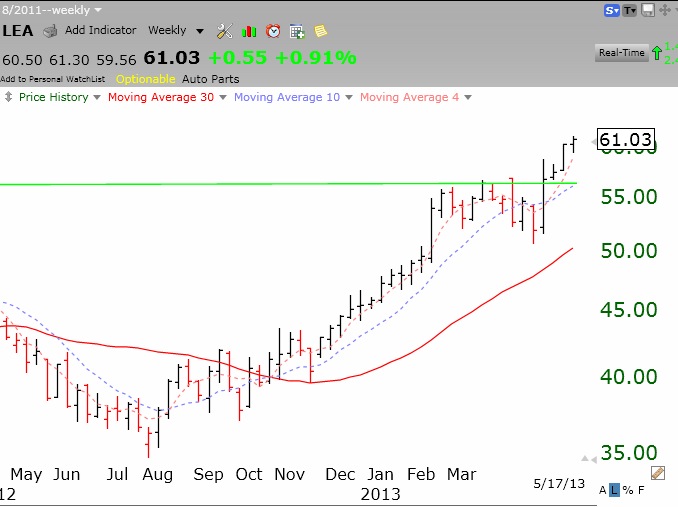
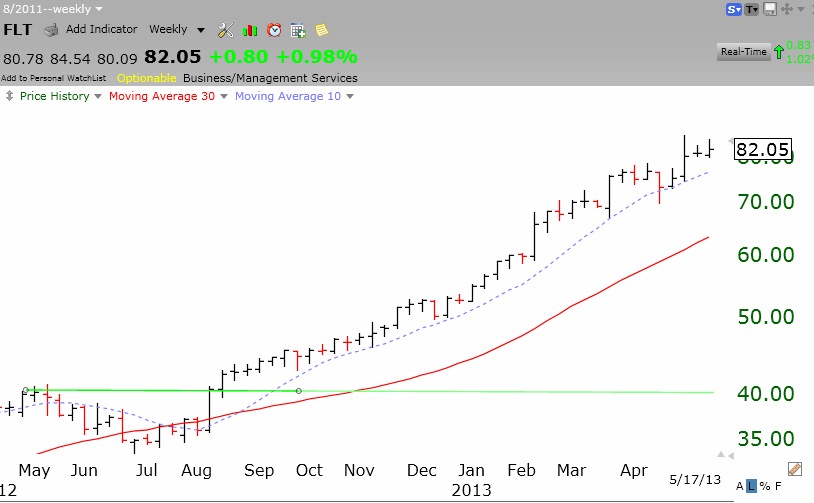
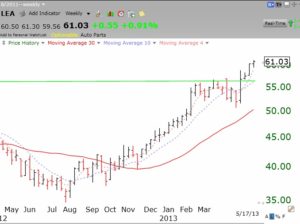
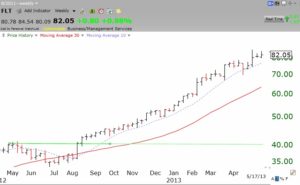
I try to do some of the work for you by reviewing the new high list and posting green line break-outs for you to research and track. One such recent break-out is LEA (weekly chart below), in the strong auto-parts sector. Other recent green line break-outs have occurred in: SAIA, EQT, SNDK, MOH, HCI, PCH, LOPE, TREX, MTN, USNA, DRQ, TSO, TRIP and WHR. They are worth checking out. I own a few of these. Most will not explode up like TSLA, but many may go on long advances like FLT below. Why are so many people averse to buying stocks that break from a multi-month base (green line top) to a new all-time high? In the stock market I do not want to buy “bargains.”
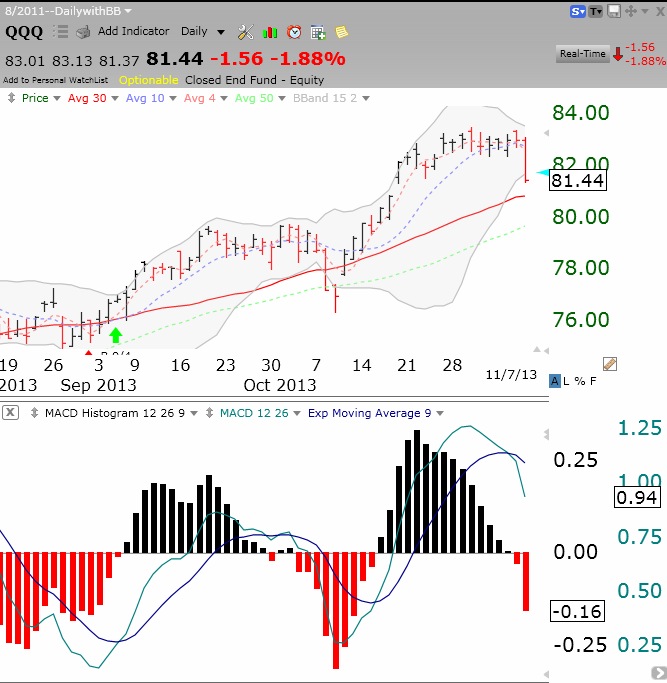
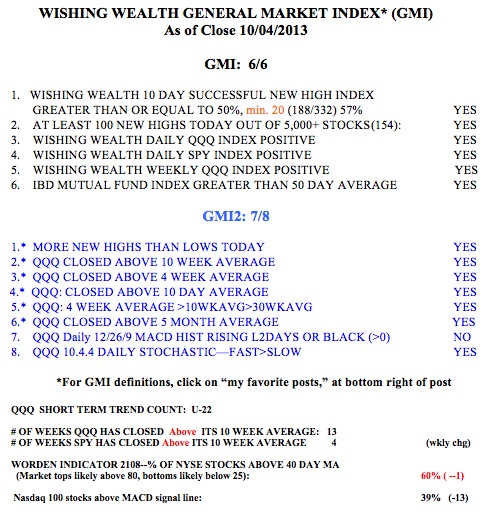
Meanwhile the GMI remains at 6 (of 6) and the markets remain in an up-trend.