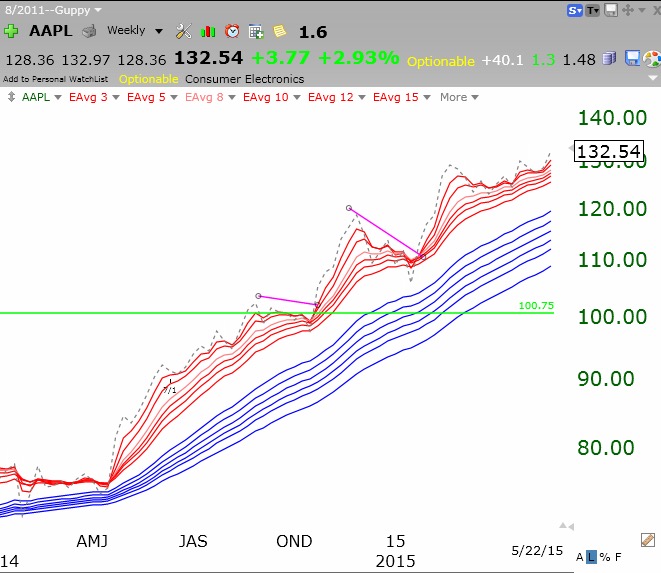
With AAPL showing strength, it looks like this market will move higher. Check out AAPL’s daily chart.
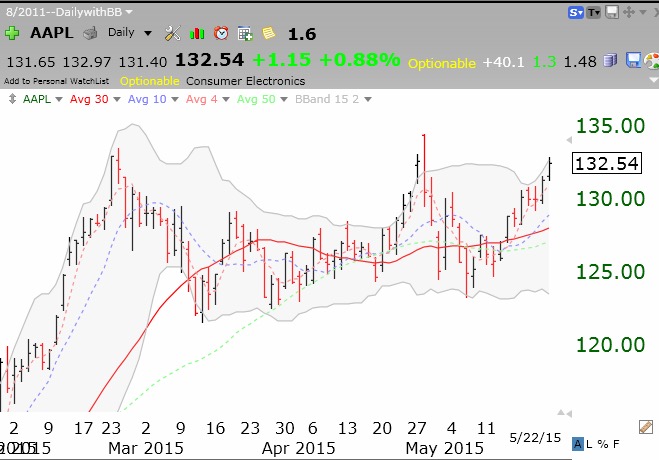 And its strong RWB pattern.
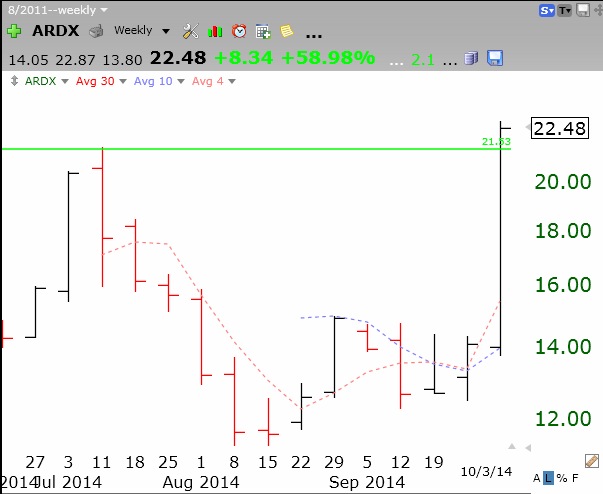
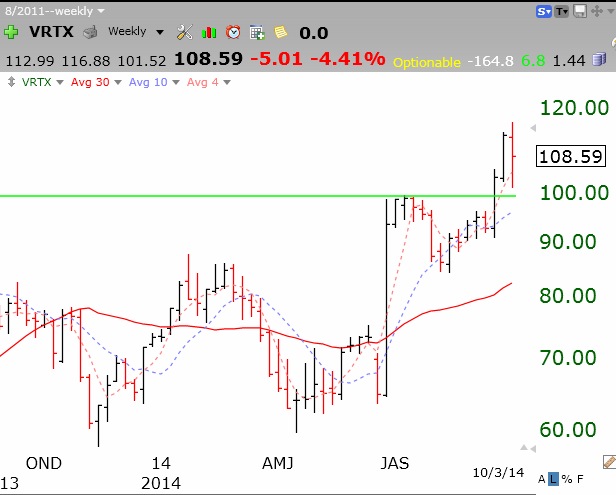
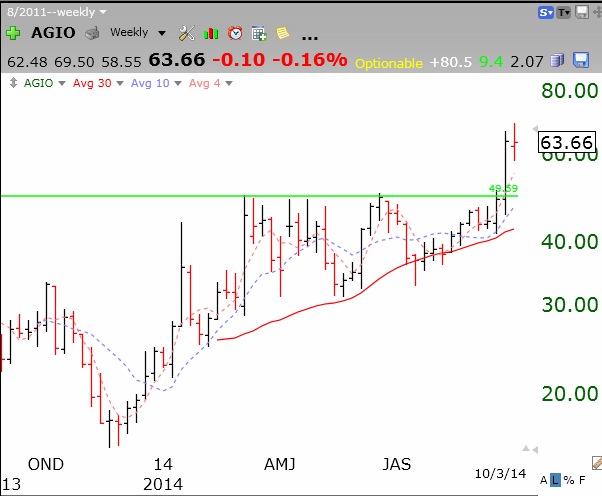
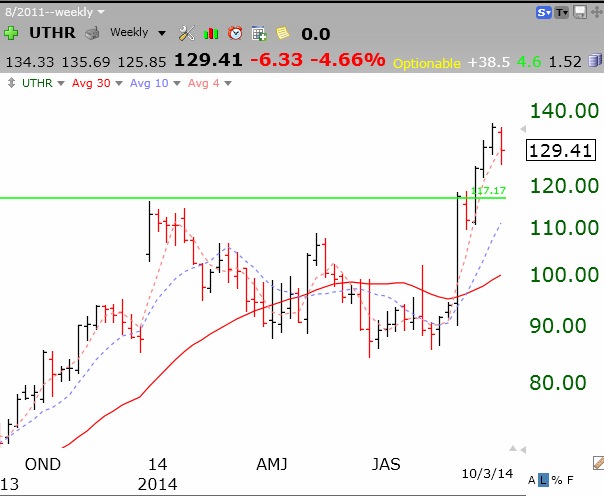
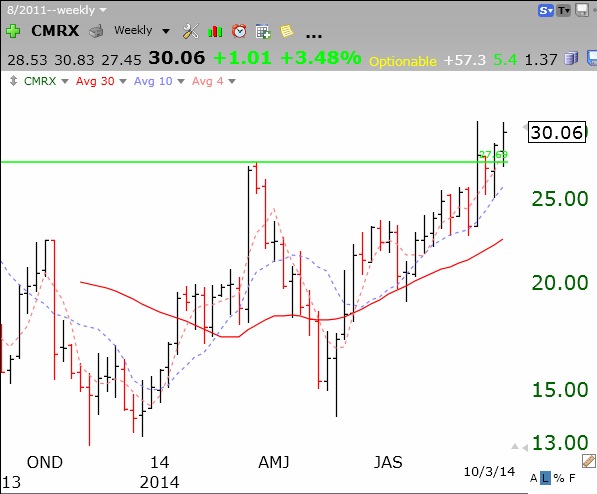
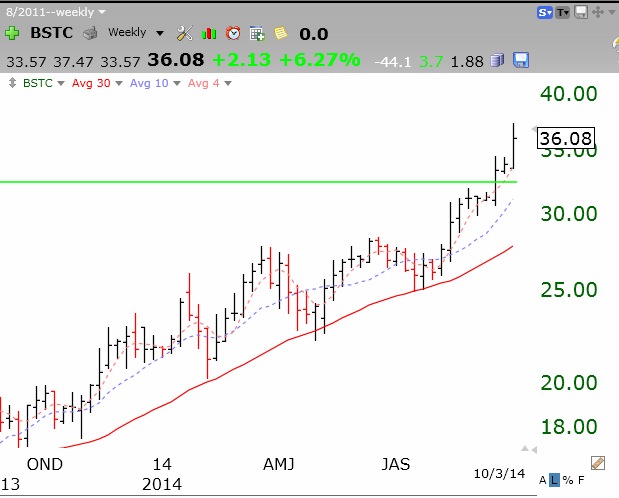
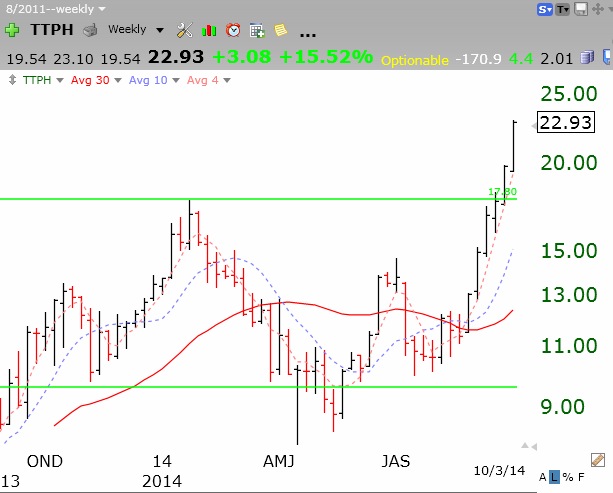
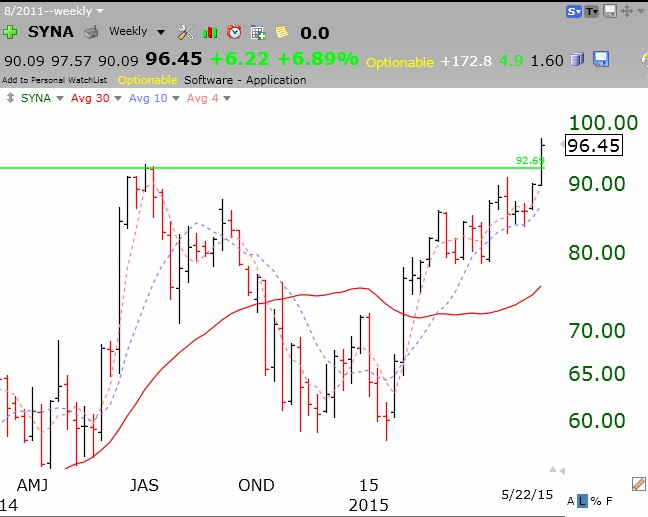
Stocks are breaking through their green line tops to all-time highs. Like SYNA
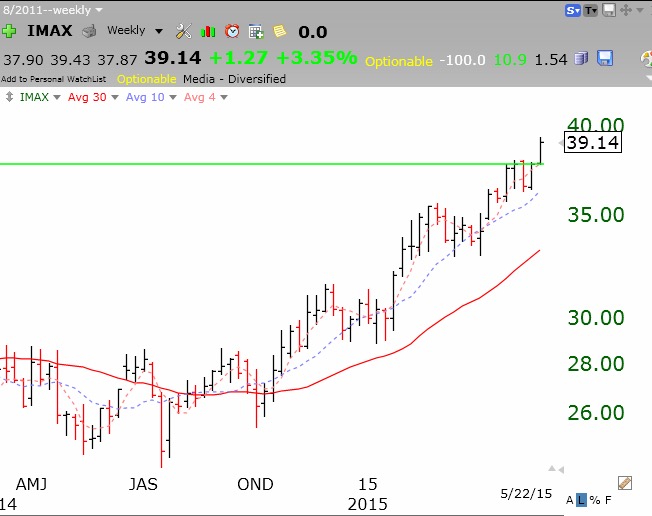
And IMAX
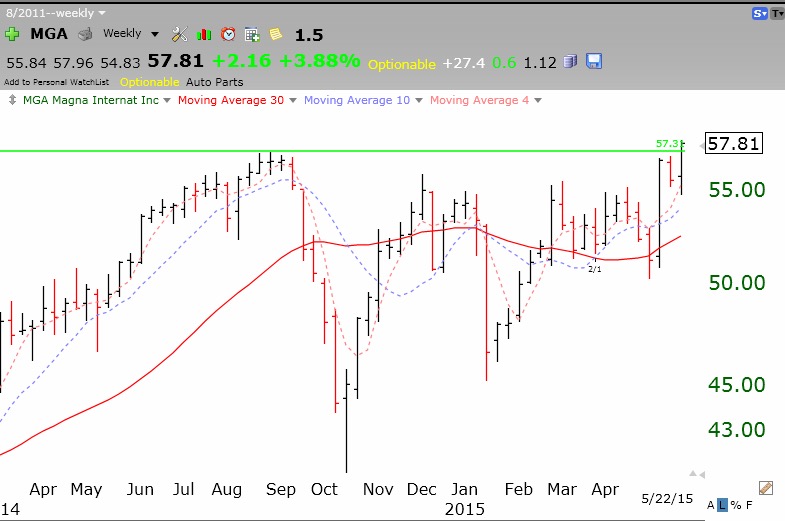
 And MGA
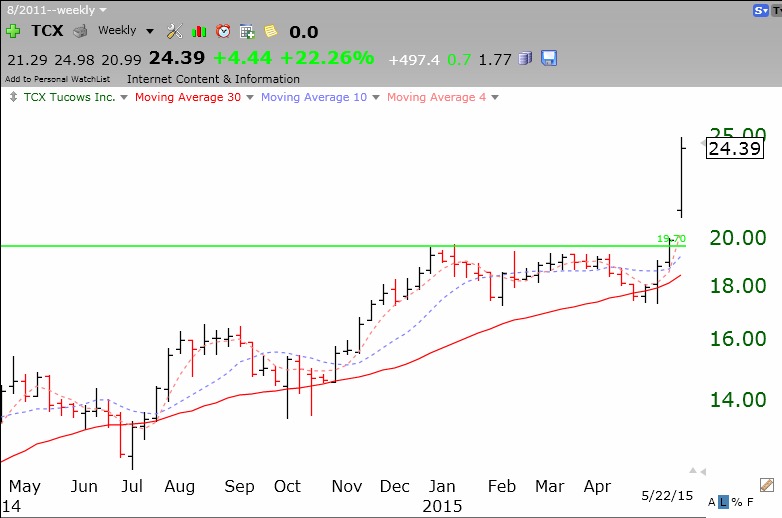
 And TCX
 And CTRP
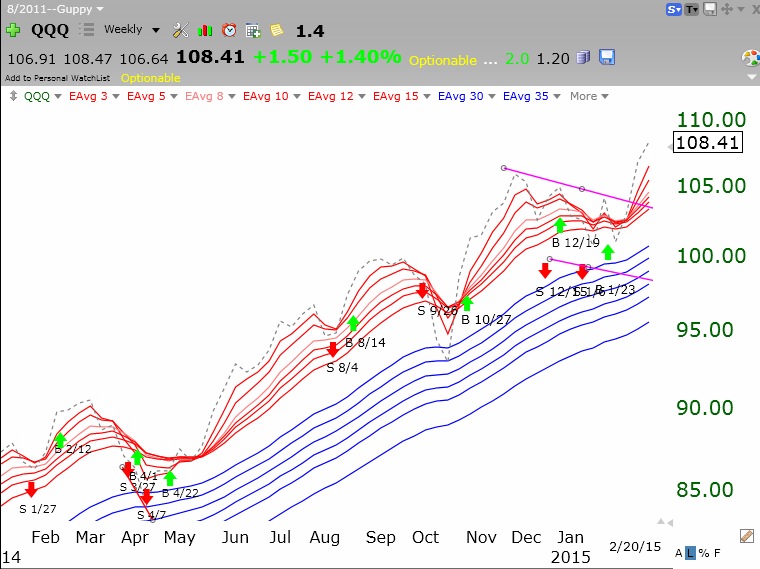
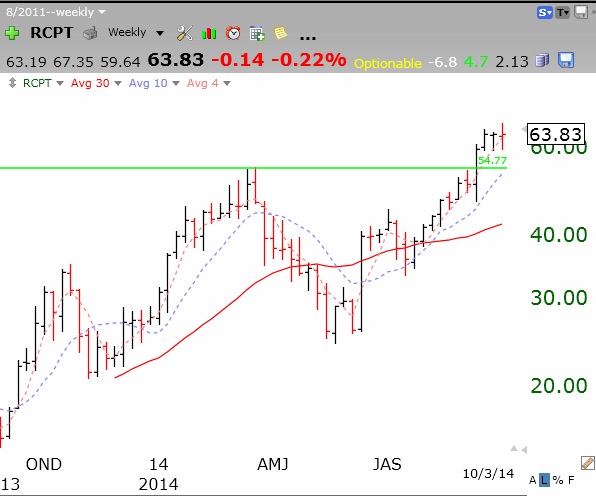
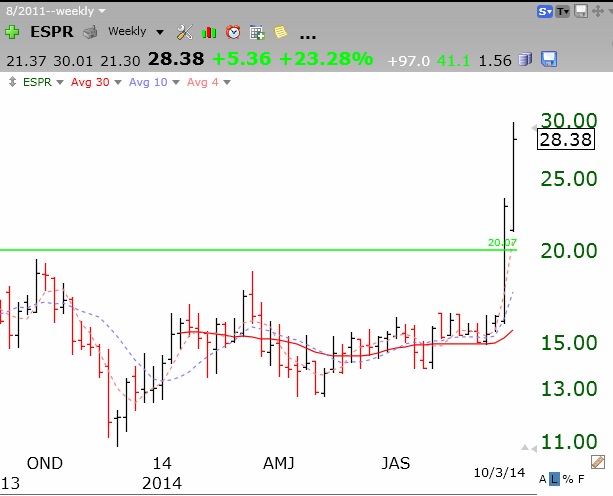
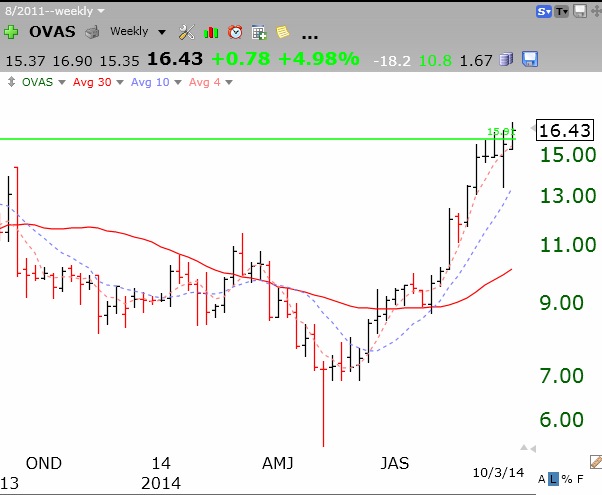
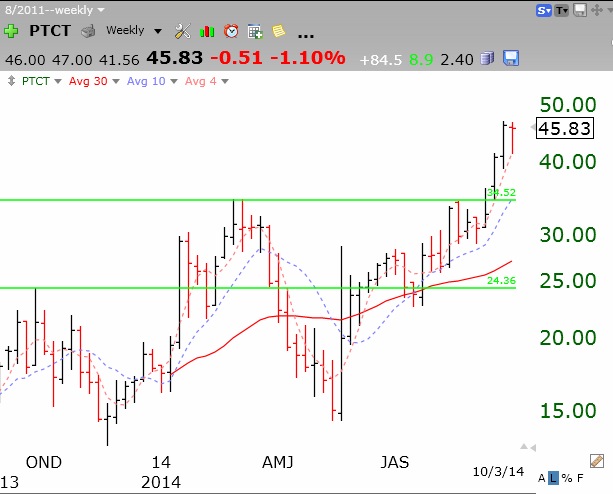
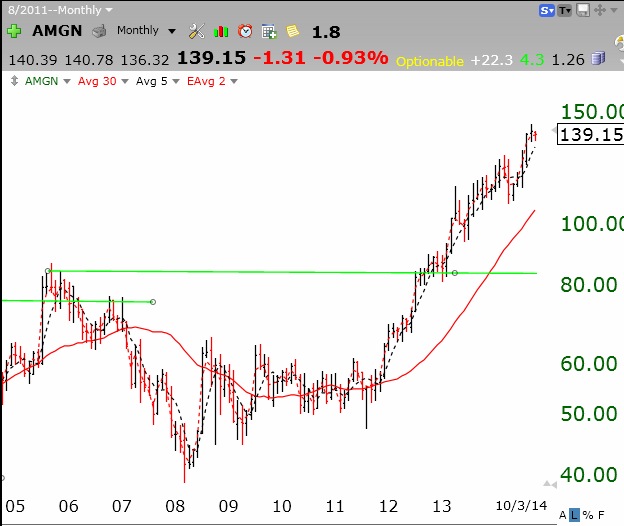
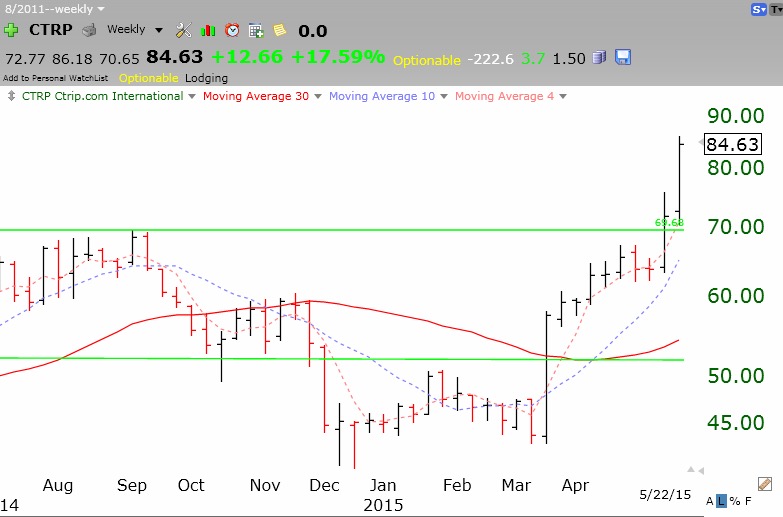 I like to hold stocks that break up through their green line tops (GLB) as long as they stay above their green lines.
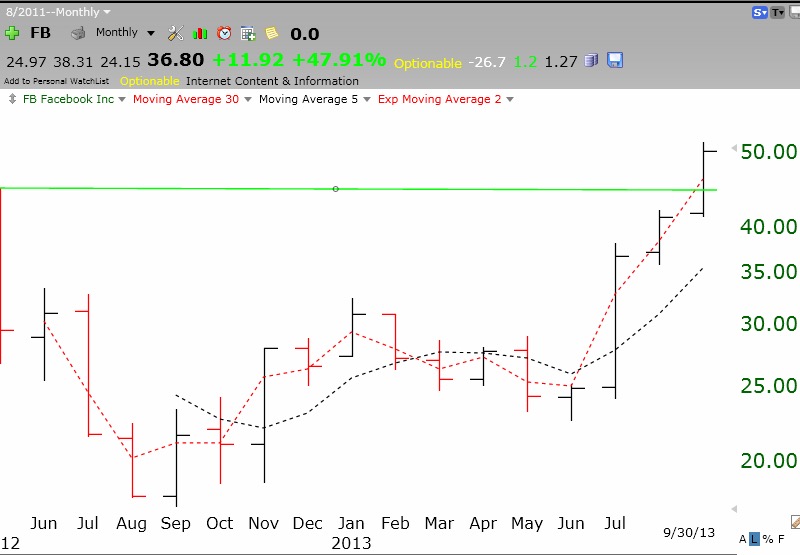
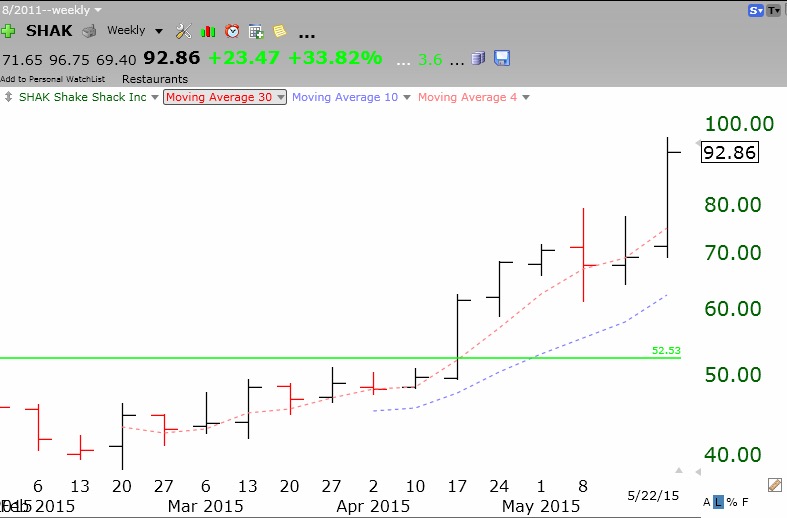
A green line top occurs when a stock reaches an all-time high that it does not exceed for at least 3 months. By definition, an IPO may not have existed long enough to rest for 3 months. I rediscovered what Jesse Livermore once wrote. If an IPO opens strong and then recedes from its peak for a few weeks, buy it when it breaks to a new high. As Jesse said, it means something has changed. FB did this quite a while ago, although it took it almost two years until 2013 (monthly chart) to hit a new high.
 SHAK flashed the buy signal much more quickly, after 12 weeks (weekly chart). It pays to watch the IPOs for this truncated GLB pattern.
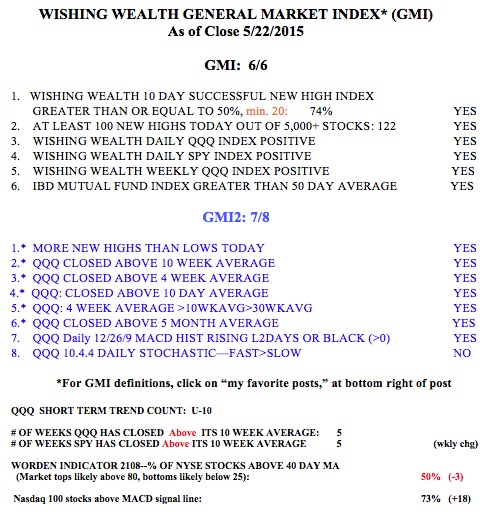
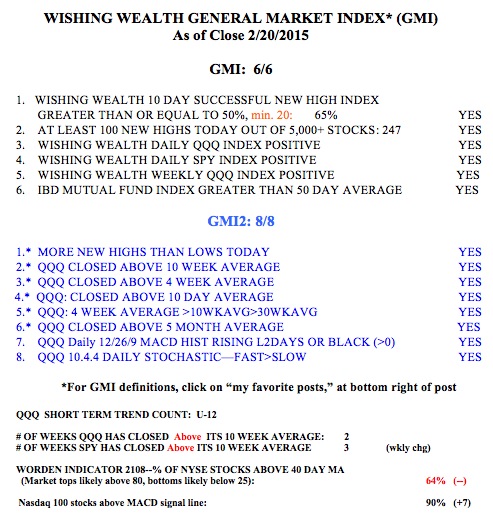
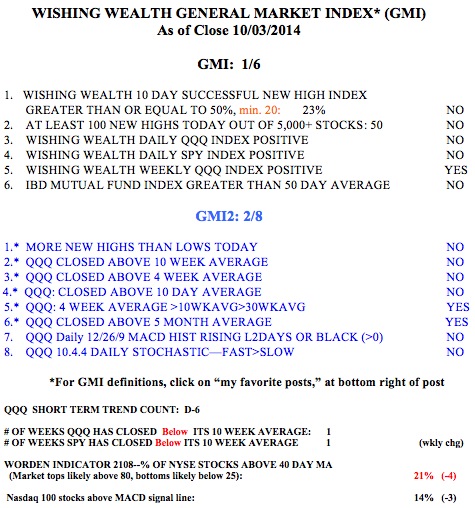
The GMI remains at 6 (of 6).