Wouldn’t you know that the extreme market action would occur just after I went on vacation? I was not surprised by the down market last Monday. When stocks have a bad week and end on a down note on Friday, people get scared over the weekend and sell on Monday morning. The depth of the Monday flash crash was very scary, however, and will probably affect the market for some time. It is interesting to me how few commentators are stressing the utter failure of the exchanges to have an orderly market open on Monday morning! Fortunately, as my readers should know, I have been exiting the market for weeks. I have been 90%+ in cash and am now 100% in cash in my trading accounts.
I listened to the CNBC market pundits occasionally for entertainment, not to follow their advice. I discovered this neat site while looking for the famous quote in October 1929 by the economist of the day who said the market had reached a permanent high plateau, just before the October 1929 great crash! In searching for the quote, I found this site which shows graphically how wrong the economists, businessmen and politicians at the time were about the future impact of the October 1929 decline on business and the stock market. Note the assertions similar to those we heard this week, that business was good and would not be affected by the market action. Note also that the October 1929 crash was only the first leg down of a multiyear decline that bottomed out in 1932 with the Dow below 50 during the Great Depression. I show my students a more recent example of the sagacity of market pundits during Enron’s dissent from $90 to 0. The great Wall Street stock firms kept recommending that their clients buy or hold Enron stock as it fell to nothing. After seeing that example, my students have a healthy skepticism for most brokers’ advice. As I warn them, their broker will make them broker. So it did not surprise me when I listened to the CNBC pundits in recent days saying that the market decline had nothing to do with business conditions, which look just fine to them now. History does not exactly repeat it just rhymes…
The huge Boomer bulge in the population has driven cultural events all of my life, from turning our parents to read Dr. Spock for child rearing advice, to the hippie culture of the 60’s, the boom in college enrollment, and to the huge economic boom of the 80’s and 90’s as the Boomers reached peak earning power grew their families. Now we Boomers are heading toward retirement. Most have mainly Social Security and 401 (K) earnings to sustain us. What do you think the Boomers are going to do with their pension investments after last week’s market action? I suggest many will reduce their exposure to stocks, and cut spending on luxuries and big ticket items. Money protected in low yielding CDs and even savings accounts is safer and more attractive than money invested in stocks and even ETFs. So, right or wrong, I suspect that we will see Boomers exiting the market, especially if the indexes retrace a little more of this vicious decline and they can get out near their recent account balance highs. If the markets start to fall again and break last week’s lows, I fear we will see a protracted decline that will extend for months and thousands of Dow points. Bear markets used to last 10 months.
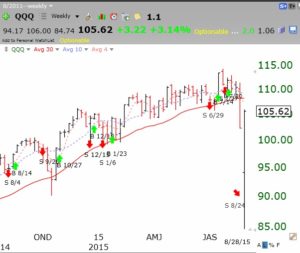
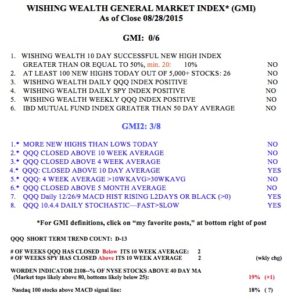
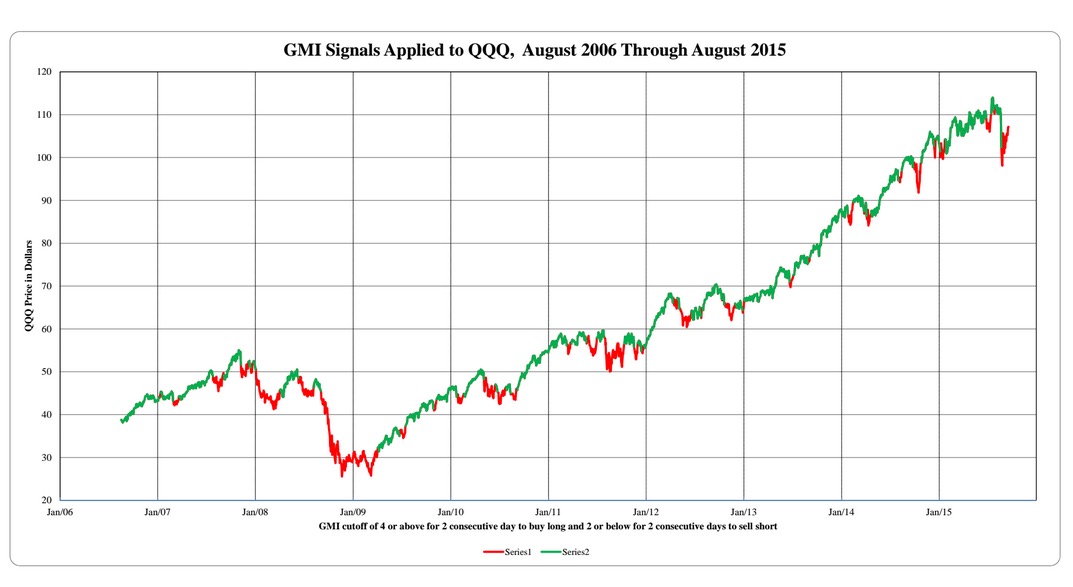
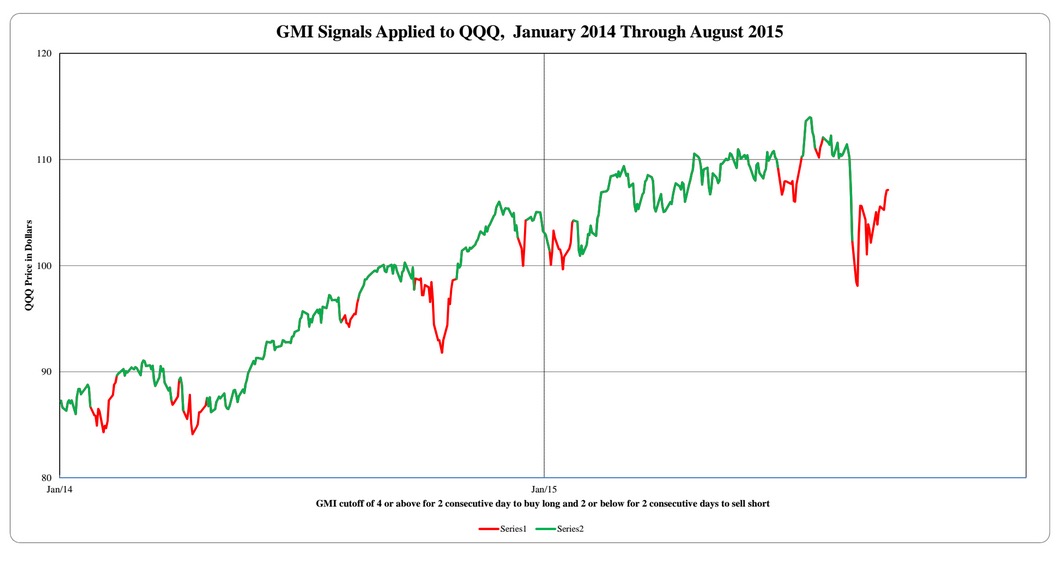
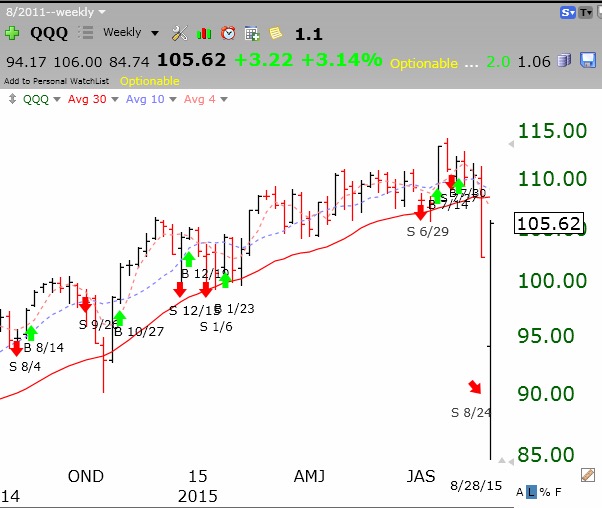
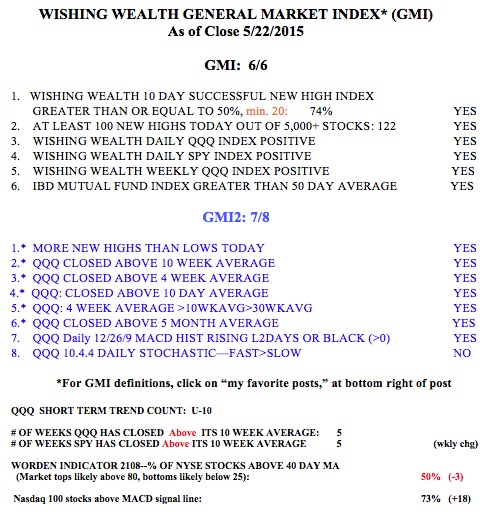
While all of my trading accounts are in cash, I am less able to time the market in my pension mutual funds in my 401 (K). However, I will likely transfer even these funds into money market funds in the coming days or weeks. I would rather miss a further 5-10% rise than sit through a possible 20-40% decline. The GMI has now been 0 (of 6) for the past 5 days. The last time the GMI was zero for so many days was last October. That decline ended and a nice rally began that lasted thorough this summer. But compare the depth of the QQQ’s decline last October to the debacle that just occurred. The technical break-down is far greater (no, this weekly chart is not wrong). I therefore would not expect a quick resumption of the up-trend, although as we know, anything is possible when it comes to the market. If the QQQ fails to retake its 30 week moving average (red solid line) like it did quickly last October, the recent decline could be just the beginning of something nasty. Being in the seasonally weak part of the year for the market (September/October) and with the Fed likely to start raising rates by year end, I think this is not the time for me to be bravely in the market on the long side. I hope I am wrong, but I am a chicken when it comes to my investments.