One of the indicators I teach my university students to track on all their daily charts is Bollinger Bands (BB, avg=15, 2 sd). By definition, 95% of the time a stock’s prices should fall within the upper and lower bands. (This is introductory statistics and you do not have to really understand it to use it.) Thus when a stock closes above the upper band or below the lower, prices often revert to the average (in this case its 15 day moving average). I like to time my trades based on this indicator. I do not want to buy anything outside its upper band unless it is during a break-out. Rather, I look for bounces off of the lower band to buy. Consider how you might time your buys and sells if you knew that a stock or index typically trades within the 2 bands. Check it out on your past trades.
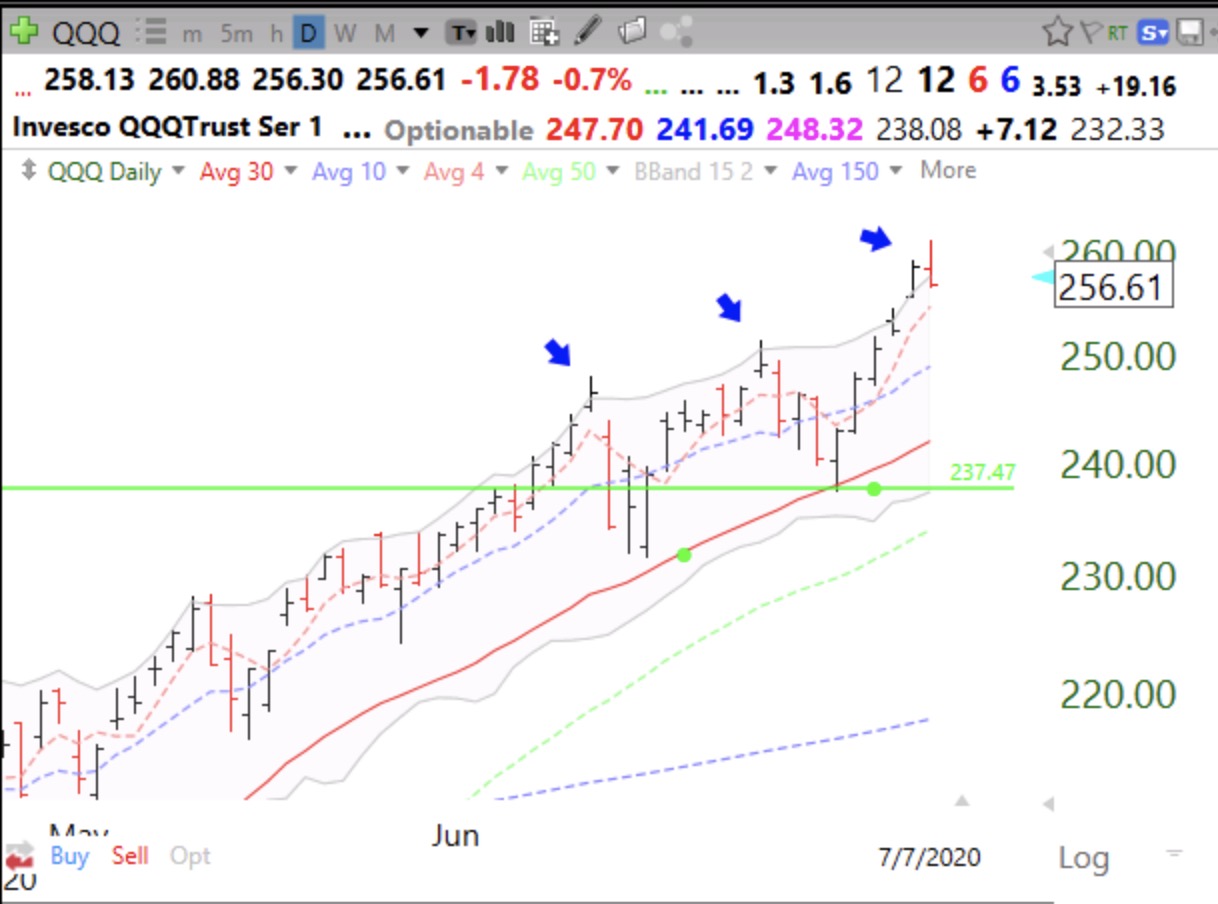
This daily chart of the QQQ shows more clearly what I am trying to describe. A chart is worth a thousand words. Note the three arrows in the chart showing the last three times when QQQ has traded outside the top band. Each of the prior two times, QQQ reverted lower to support. The past two days the QQQ has traded outside of its upper BB, suggesting to me a very overbought situation. Note how QQQ reversed to close back down on Tuesday inside its upper band. Furthermore, each night I count the number of NASDAQ 100 stocks (measured by the QQQ) that traded that day above their upper BB. I began tracking this count in January. The past 2 days I found 59 and 50 of these stocks traded above their upper BB, the highest number since I began counting. I therefore sold my growth stocks on Tuesday, and kept my GLD and a little SQQQ, as I wait out the next few days. Maybe the weakness in DIA I have been obsessing about is foreshadowing weakness in the growth stocks, finally…..