You may want to follow my intraday tweets @WishingWealth. I tweet intraday when I see something interesting–no guarantees! Do your own research.
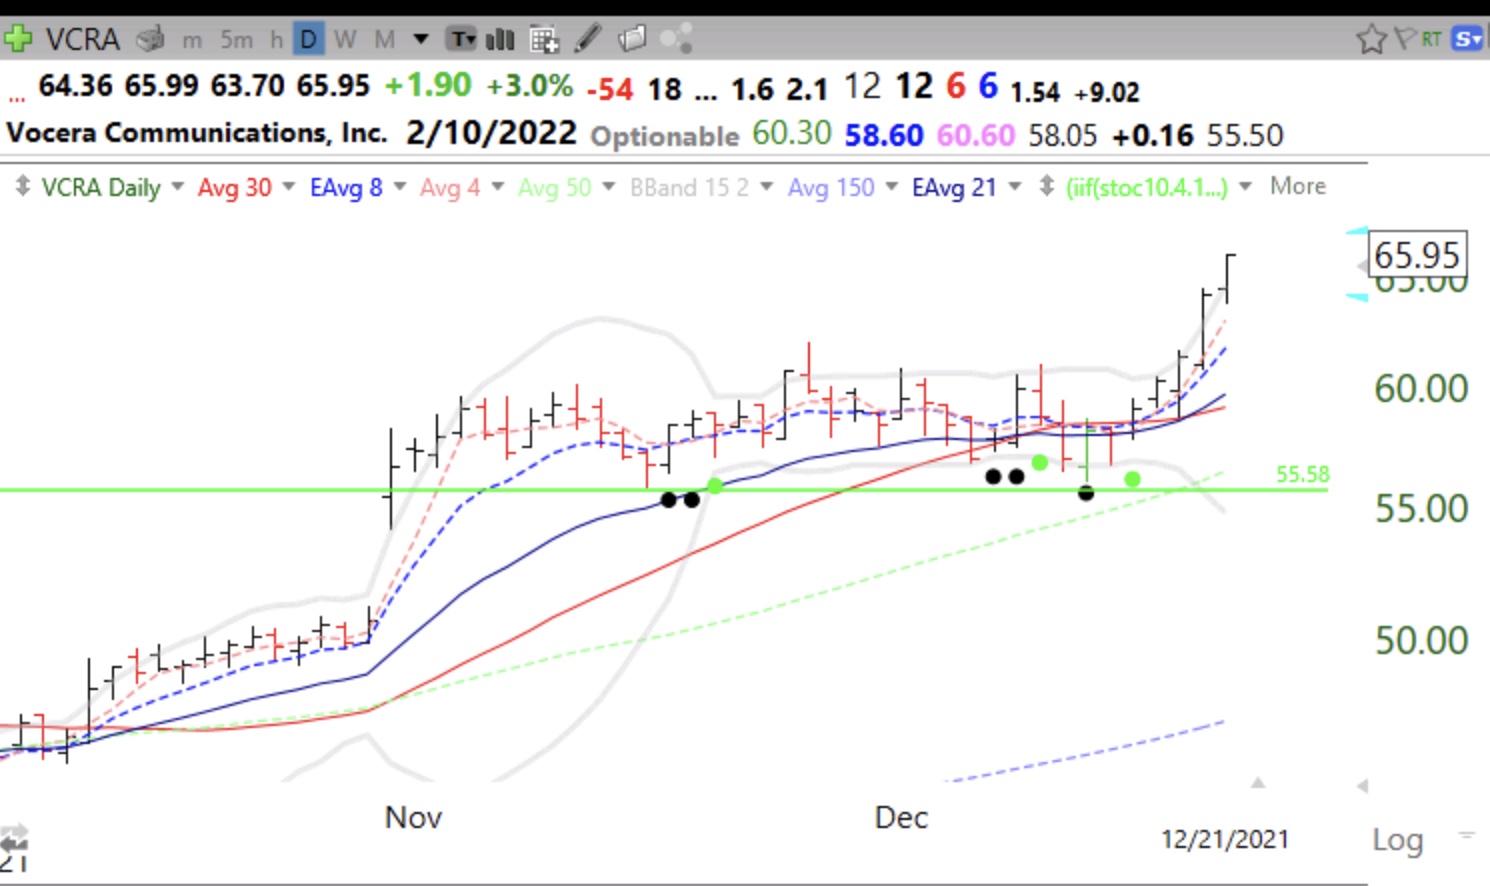
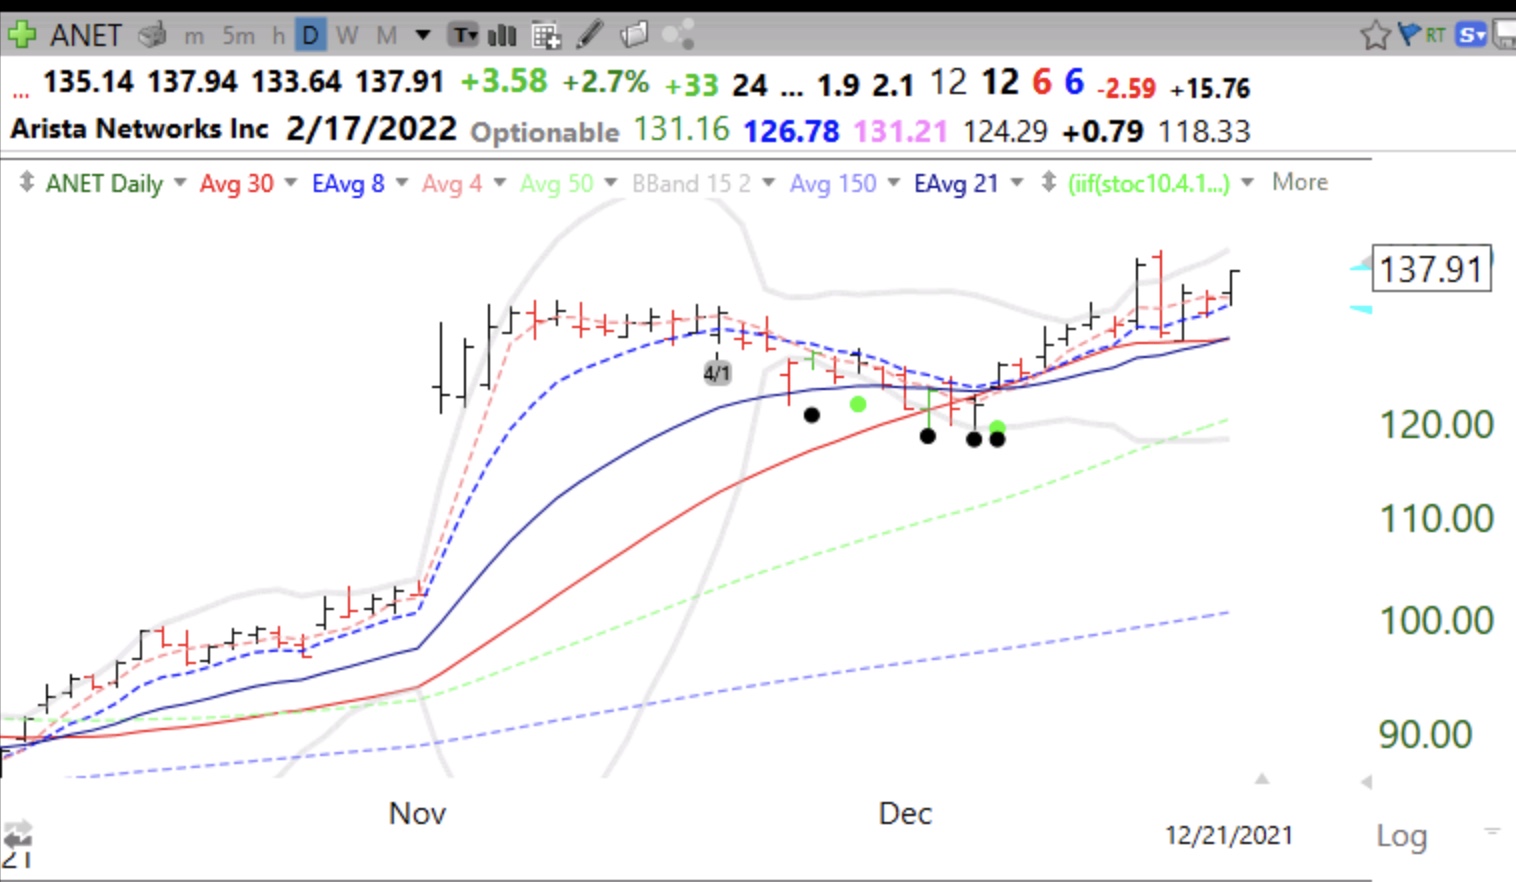
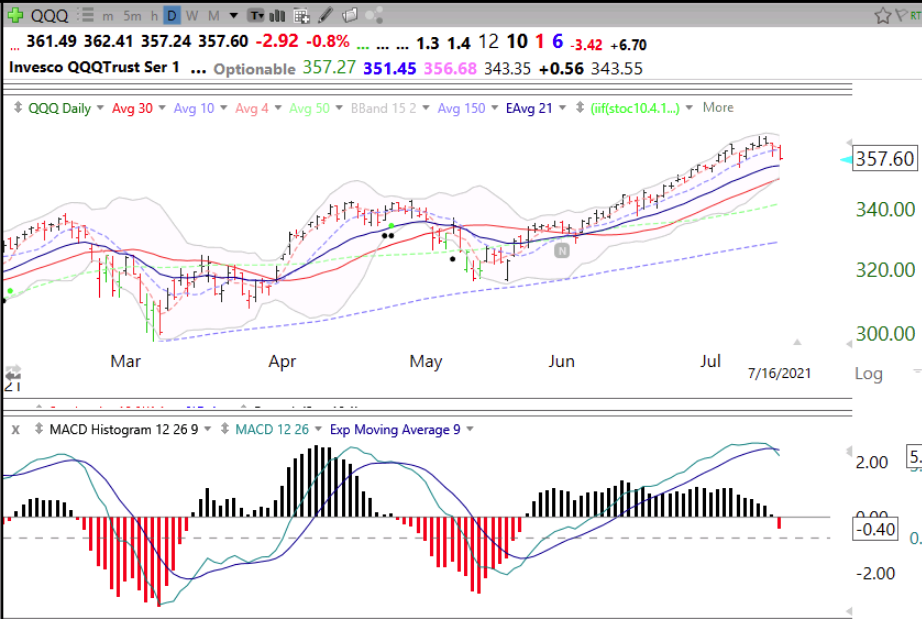
I have a simple formula I wrote for TC2000 that finds any stock that reaches an ATH in the past 100 days (use price new high built-in condition set to 250 month high within past 5 months) and that is currently within 3% of its 100 day high (C>.97*maxh100). TC2000 scans my watchlist of IBD50/MarketSmith stocks real time throughout the day. I then look at the stocks that come up and look at the built-in volume buzz indicator to see if it has unusual volume for that time of day and if I like the set-up. I then check out its fundamentals on MarketSmith. Another stock that came up in recent days is $ANET. (VCRA was not on my iBD/MarketSmith list.) Stocks holding near their ATH (all-time-high) in a correction can turn out to be leaders in a new market up-trend. Note my green and black dot indicators showing oversold bounces.