As long as the QQQ remains above its 30 week average I am trading stocks. I will not transfer my university pension funds back into mutual funds for a little longer, however. The market bottom could really be in but if the Fed starts to raise rates repeatedly again it could kill the rally. I would like to see a retest of the bottom. And many bottoms occur after October weakness. Remember the famous saying, Go away in May and come back at Halloween!
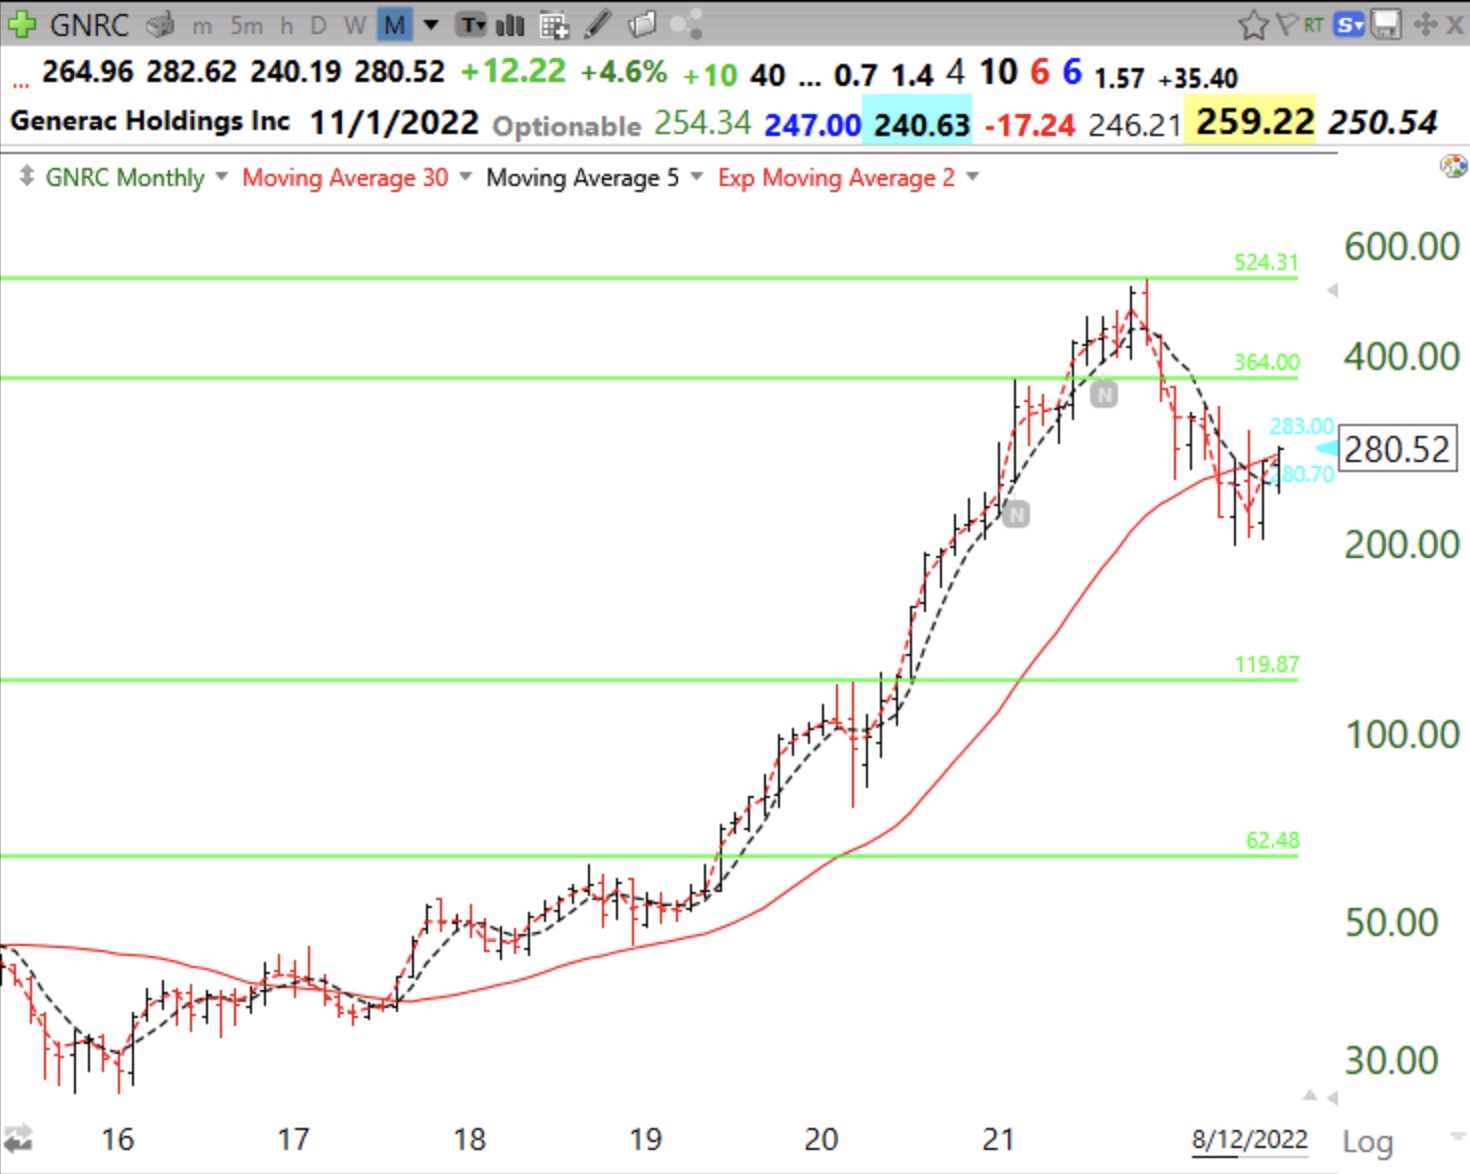
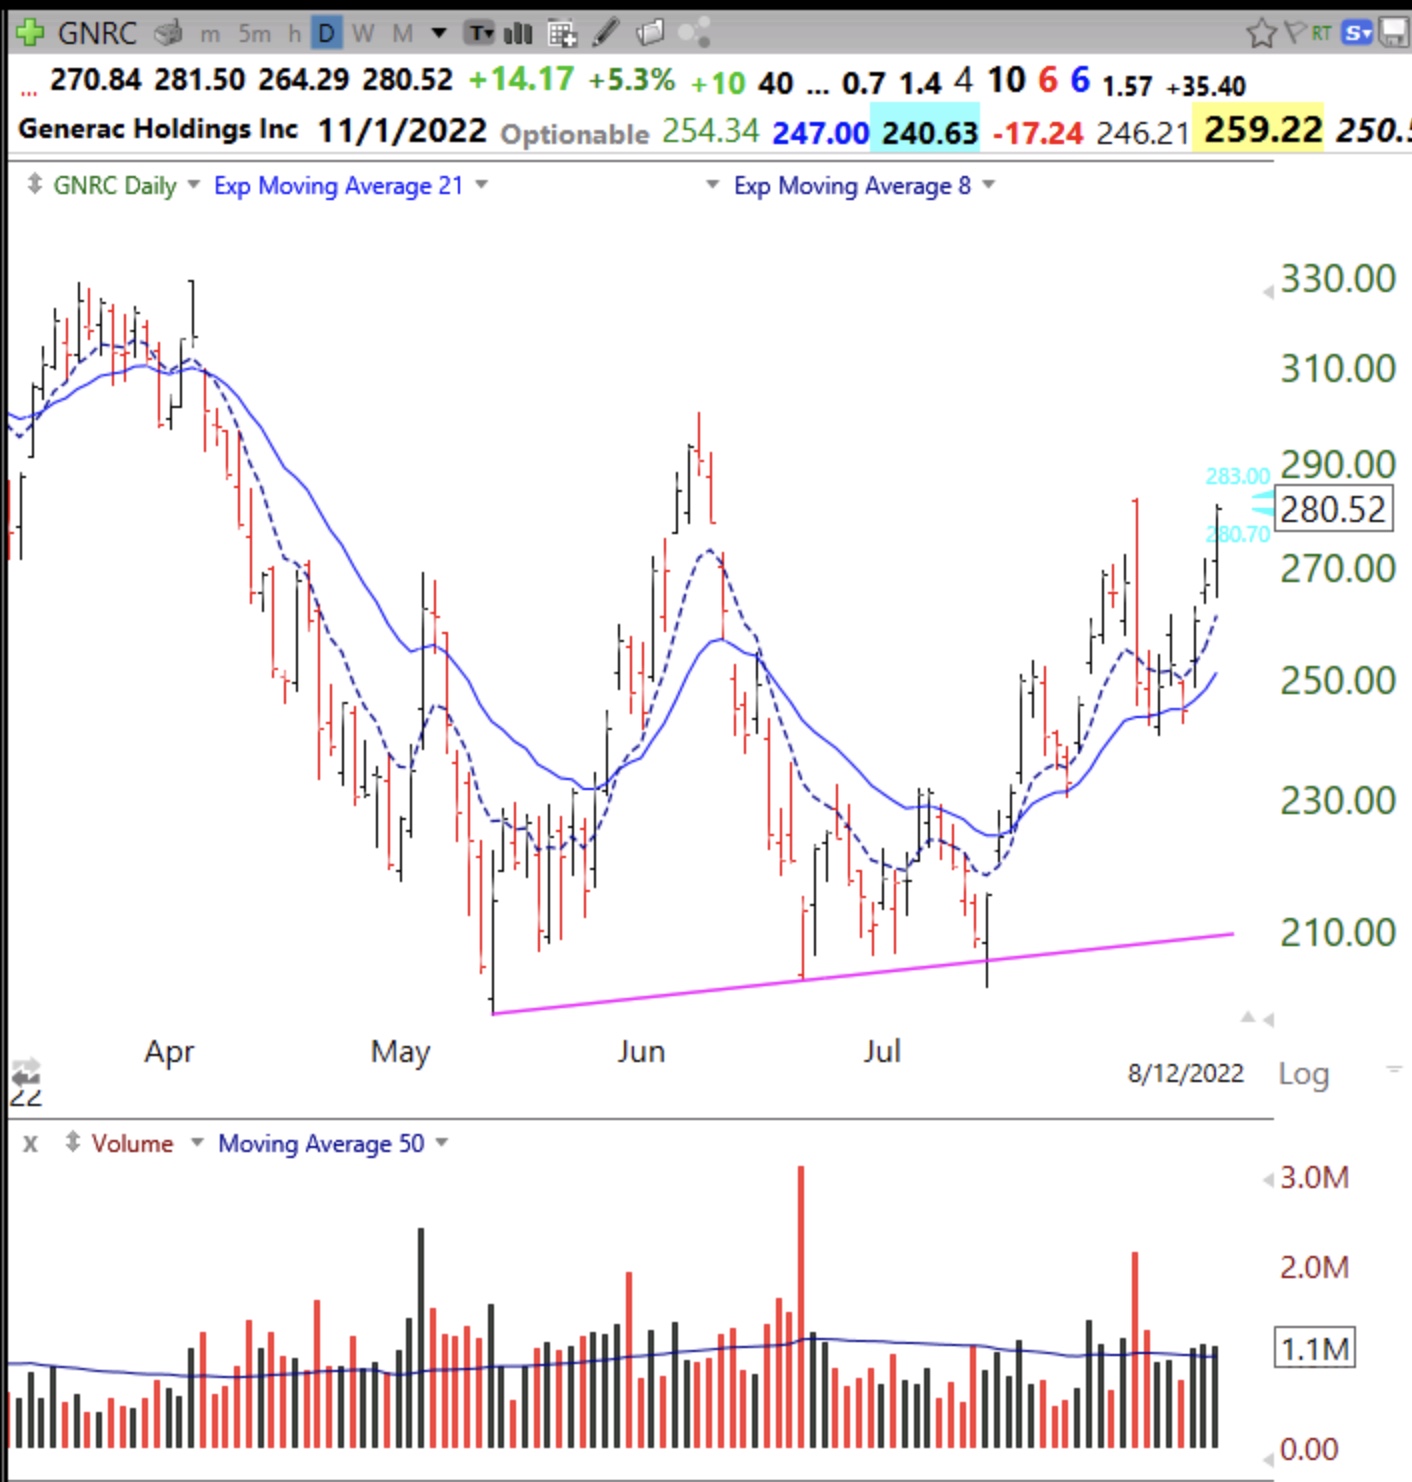
So many stocks are rising now that I can’t resist some. One stock that I am slowly accumulating is GNRC. My stock buddy, Judy, brought this company to my attention years ago. Generac makes electric generators and is also working with solar. Whenever we have bad hurricanes the stock tends to rise. And we are entering hurricane season. I am not trying to benefit from people’s misfortunes, only from a company making profits by helping customers to retain their electricity. How shocking!!!! (pun intended)
MarketSmith says 2022 earnings are expected to grow 26% and their latest quarterly earnings and sales were up 25% and 40%, respectively. Below are a few charts that helped me to analyze GNRC’s trajectory.
The monthly chart shows that the stock is below its last green line top, which is a negative for me. There are many people who bought higher that may want to sell if they can get their original investment out. But it is a seasonal rally that I am looking for. It may not take the stock back to an ATH. And maybe it will…
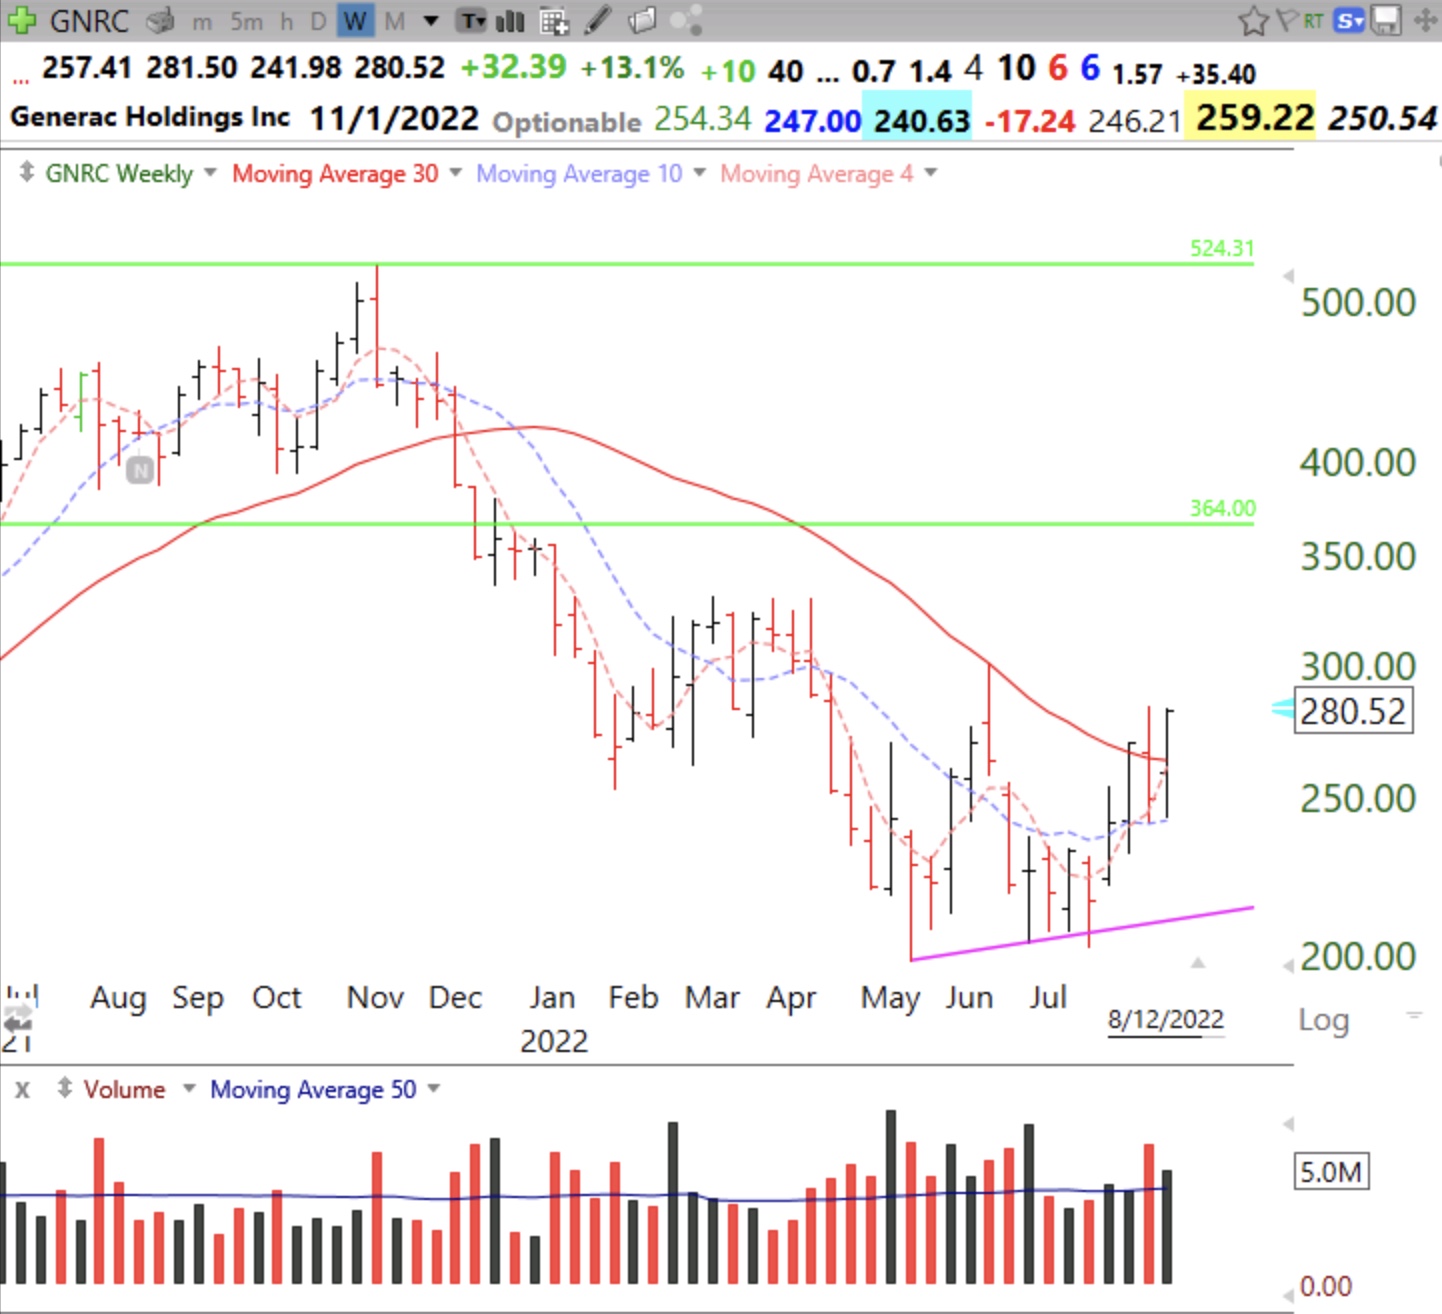
The weekly chart shows some evidence of strength. There are some big black above average volume bars at the bottom and the stock has retaken its 30 week average, a very good sign. Note it closed near last week’s high.
I also like the daily chart. Thanks to listening to Richard Moglen’s interview with Pat Walker and his appearance at my class,I have recently become a fan of the 8 and 21 day exponential moving averages. I also know that the IBD/MS folk follow the 21. Note that the 8 day exponential moving average has been above the 21 day exponential average for 18 days and bounced off of the 8 three trading days ago on Wednesday. A few days ago the stock took a big hit after earnings were released but it has recovered almost all of the decline, another sign of strength. As long as the stock holds its rising exp 8 average I believe that the up-trend is intact.
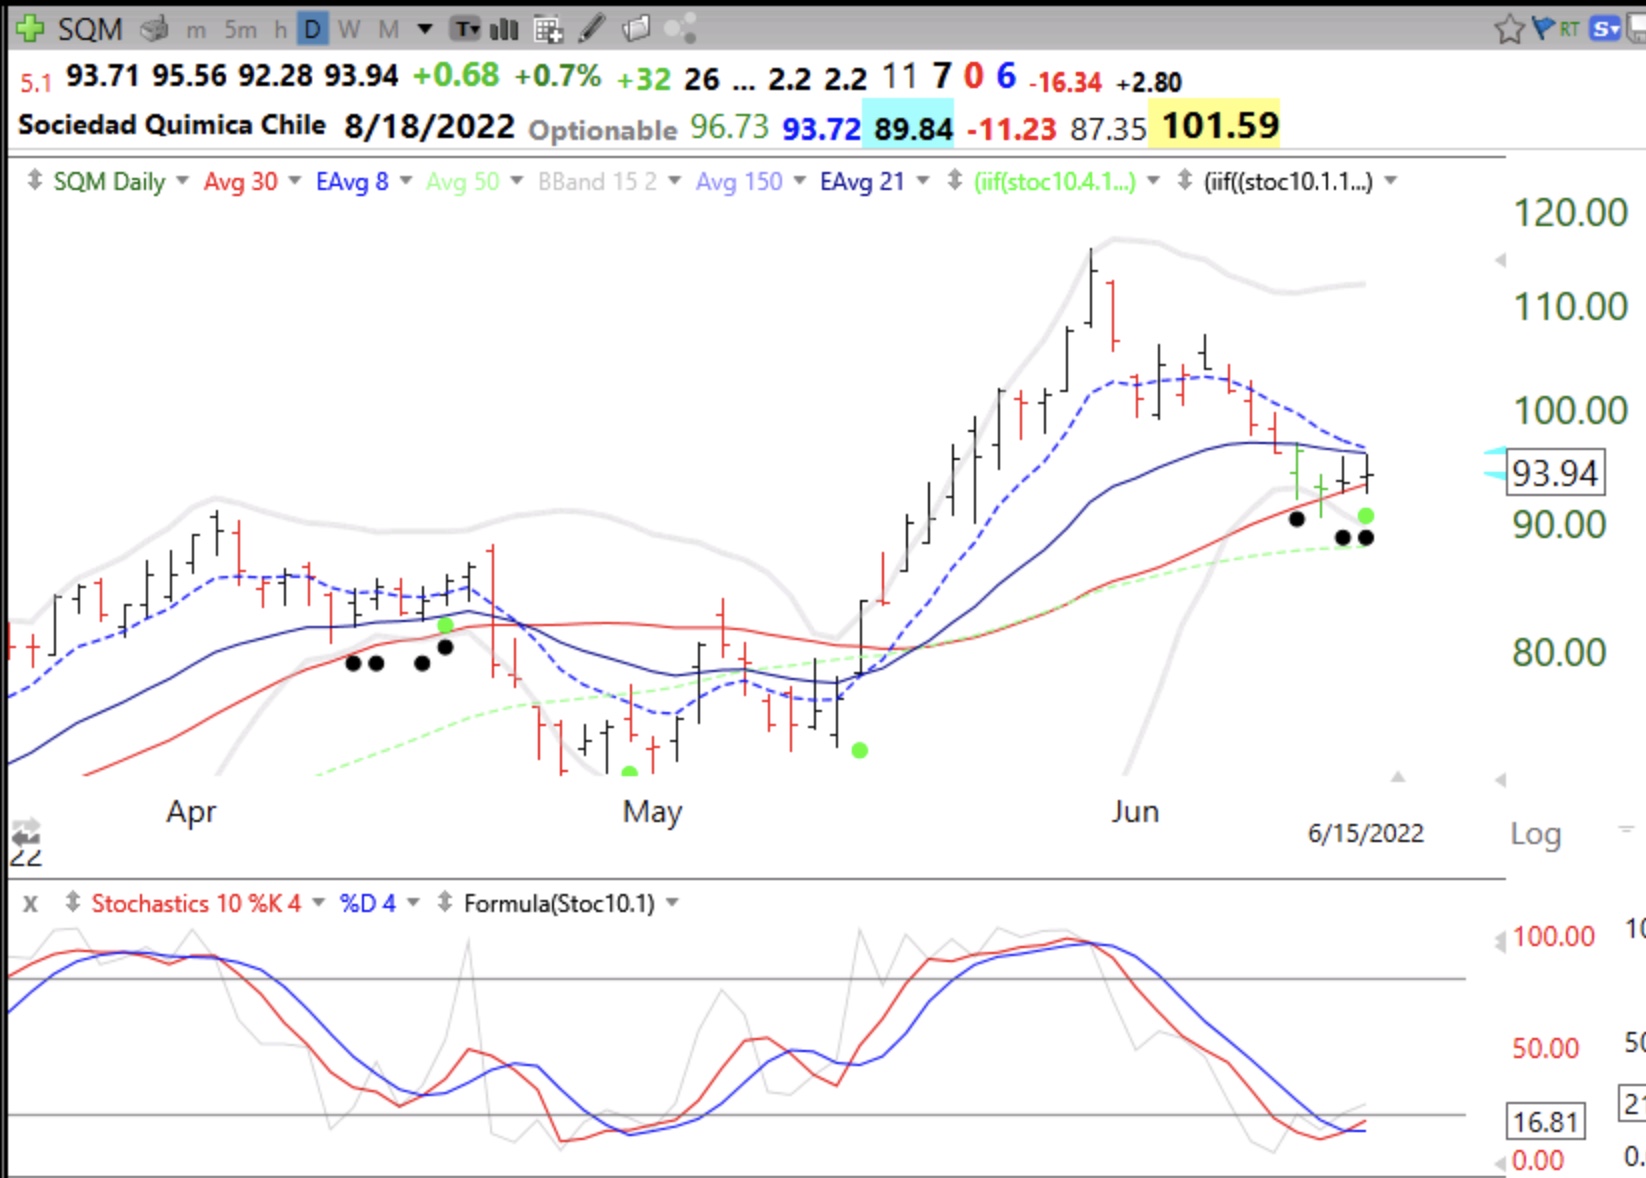
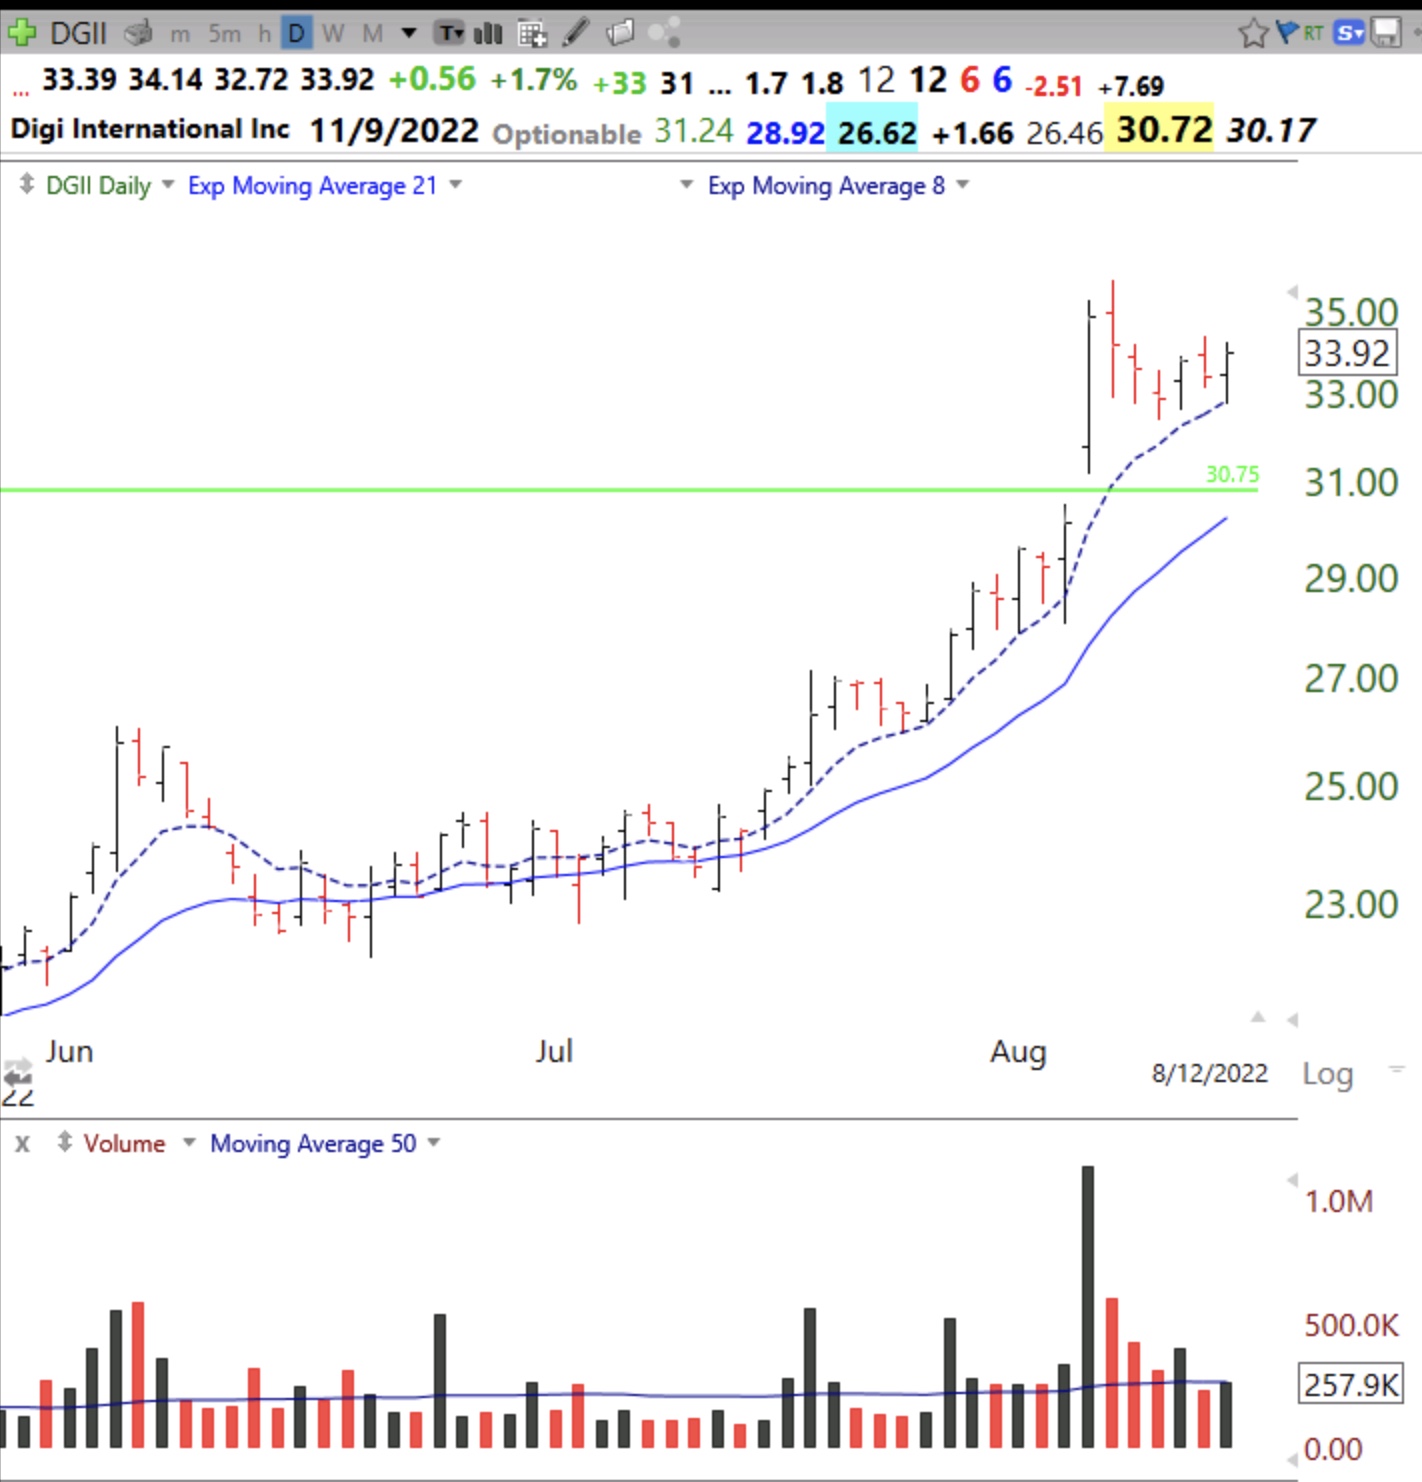
I have created a new scan to find promising stocks that just bounced up off their exp 8 day average. Here is a chart of one of them. DGII also had a recent high volume GLB, a big plus. I do not own it but let’s see if the bounce holds next week. Note how many bounces off of the rising Exp 8 it has had. If I purchase on a bounce set-up I must sell immediately if the bounce fails. Other stocks that came up on this scan are: CNC, LMT, MLI, SO and ENPH. These are not recommendations, just for teaching purposes. I always check IBD and MarketSmith statistics before I buy anything.
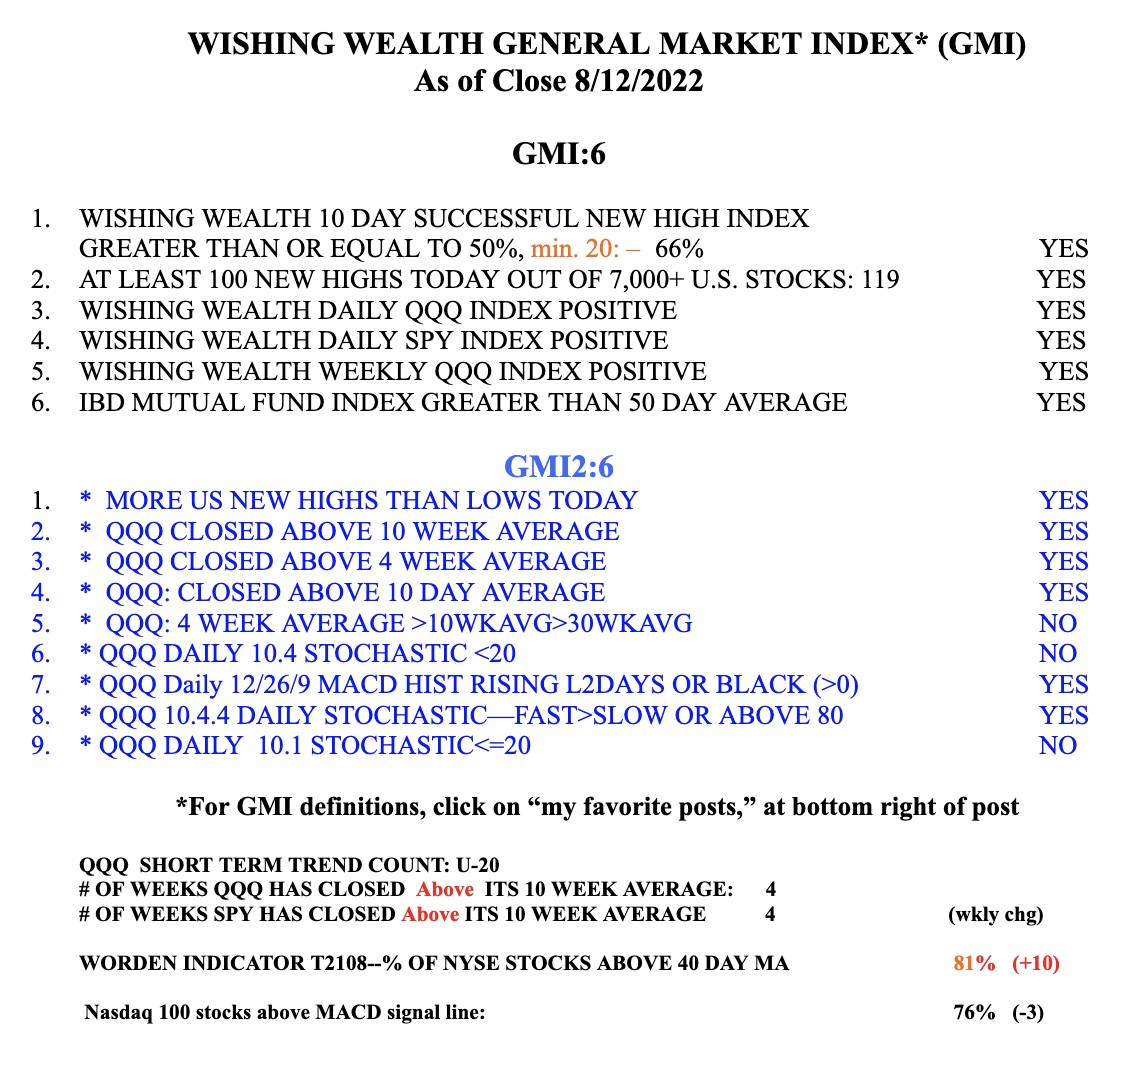
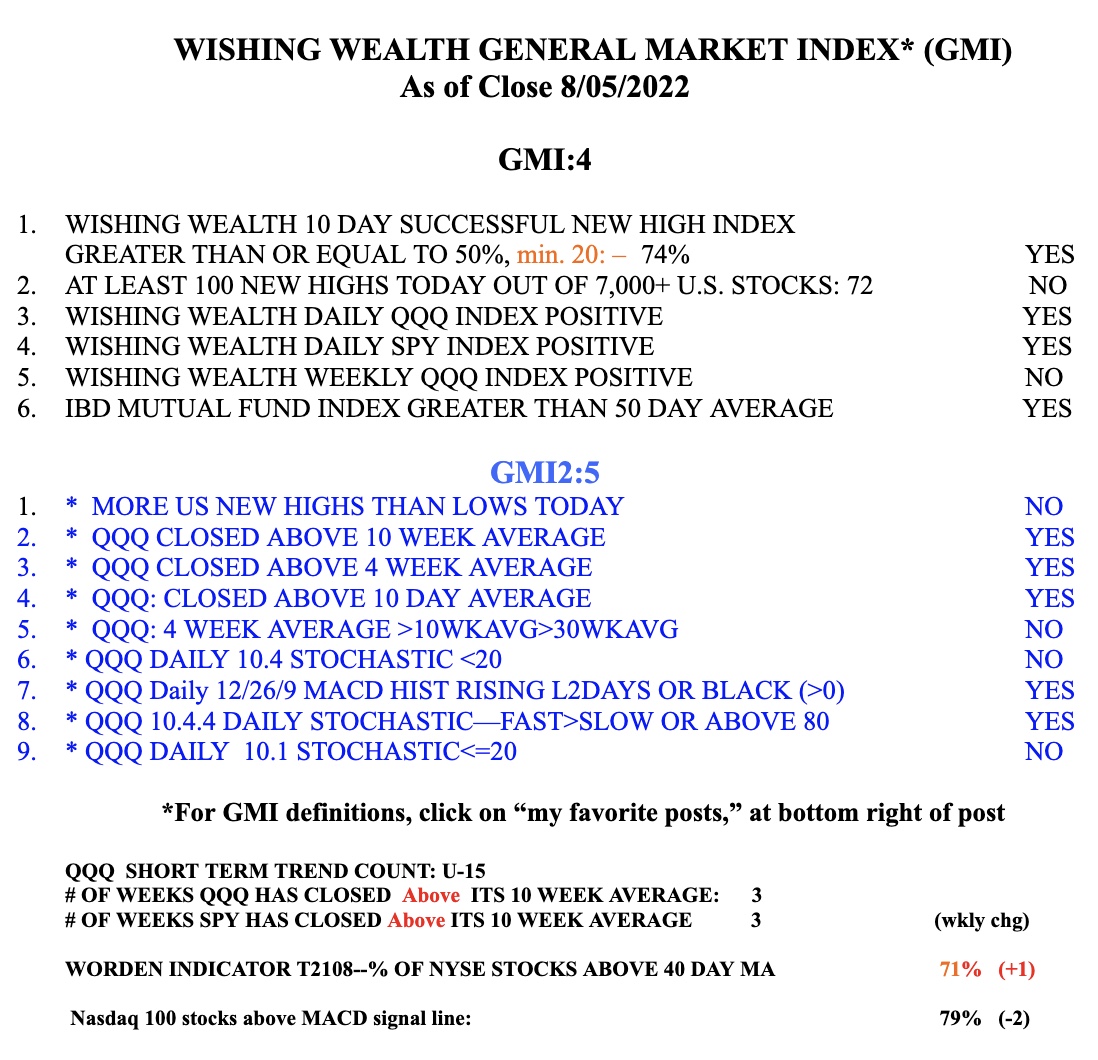
The GMI is at 6 (of 6) and remains Green.