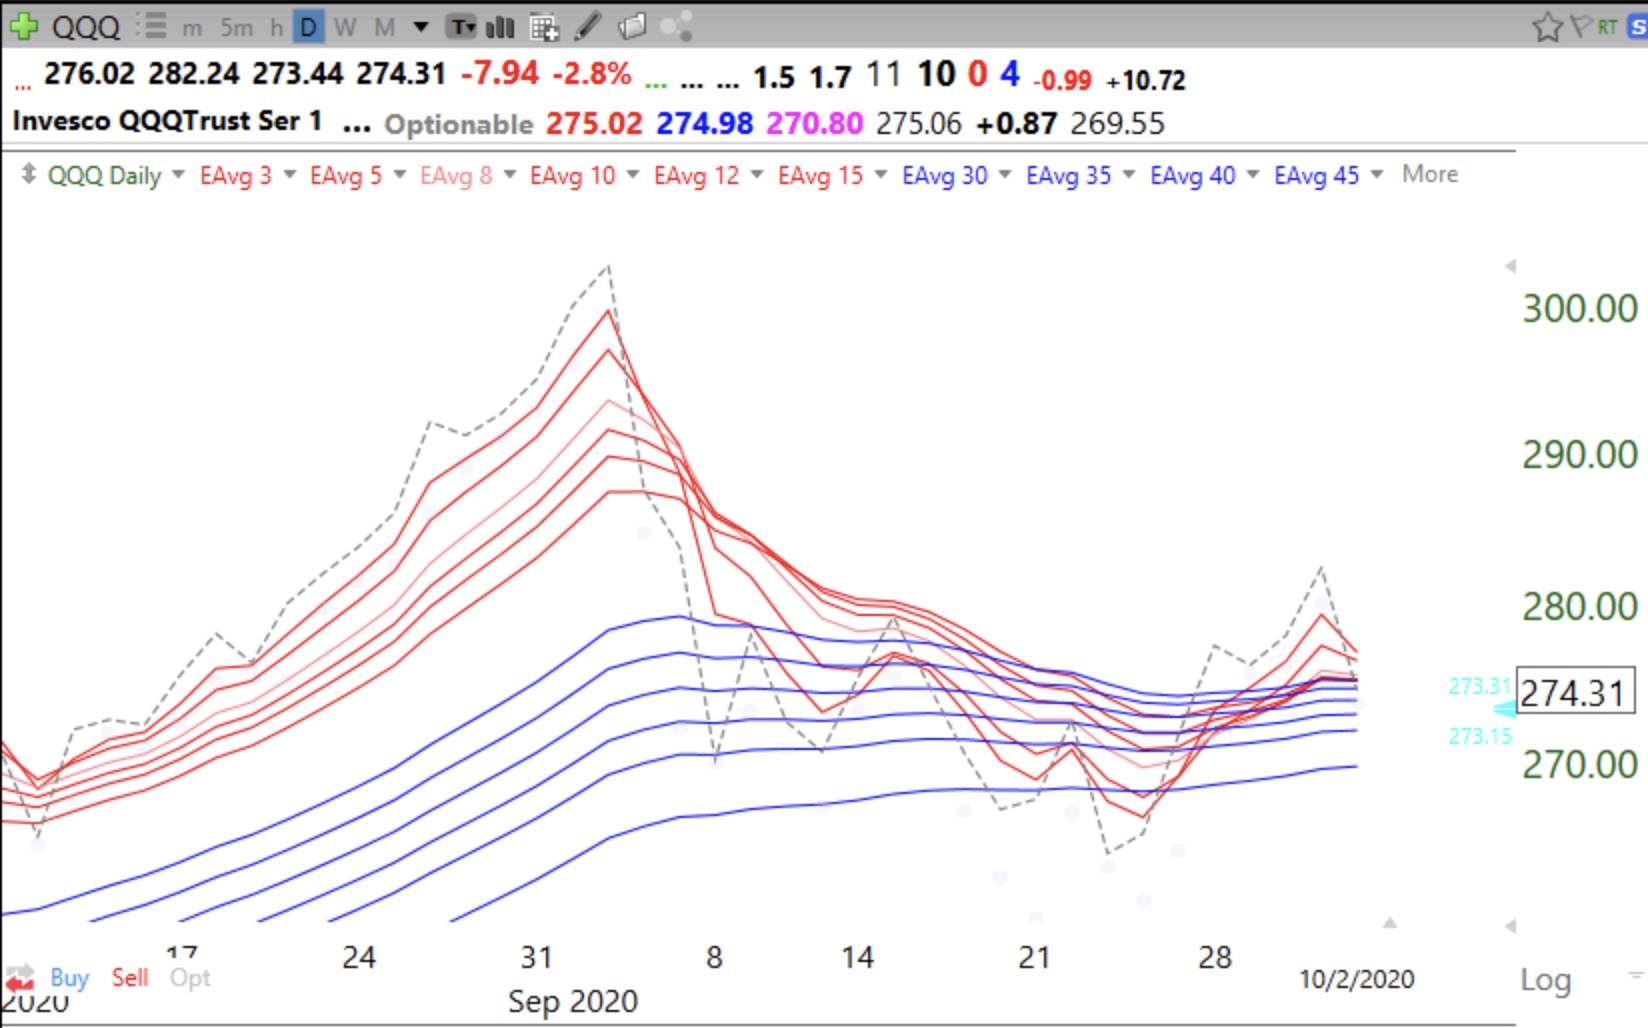
I have learned to follow the market’s direction and to ignore the media or my personal opinions. My indicators have turned up and I must heed their message. QQQ, SPY and DIA have all retaken their critical 10 week averages. So I bought some TQQQ last week and will add to it if this new up-trend continues. A new up-trend is always met with skepticism because most people remain intimidated by the recent down-trend. If the up-trend should falter, I can exit with a small loss–without emotion and no ego involvement. TQQQ is the 3x bullish leveraged QQQ ETF. It is designed to move 3x as much as the QQQ—up or down. I have found many times that TQQQ will rise in a sustained up-trend more than 90%+ of individual stocks. Also, many individuaql stocks are breaking out.
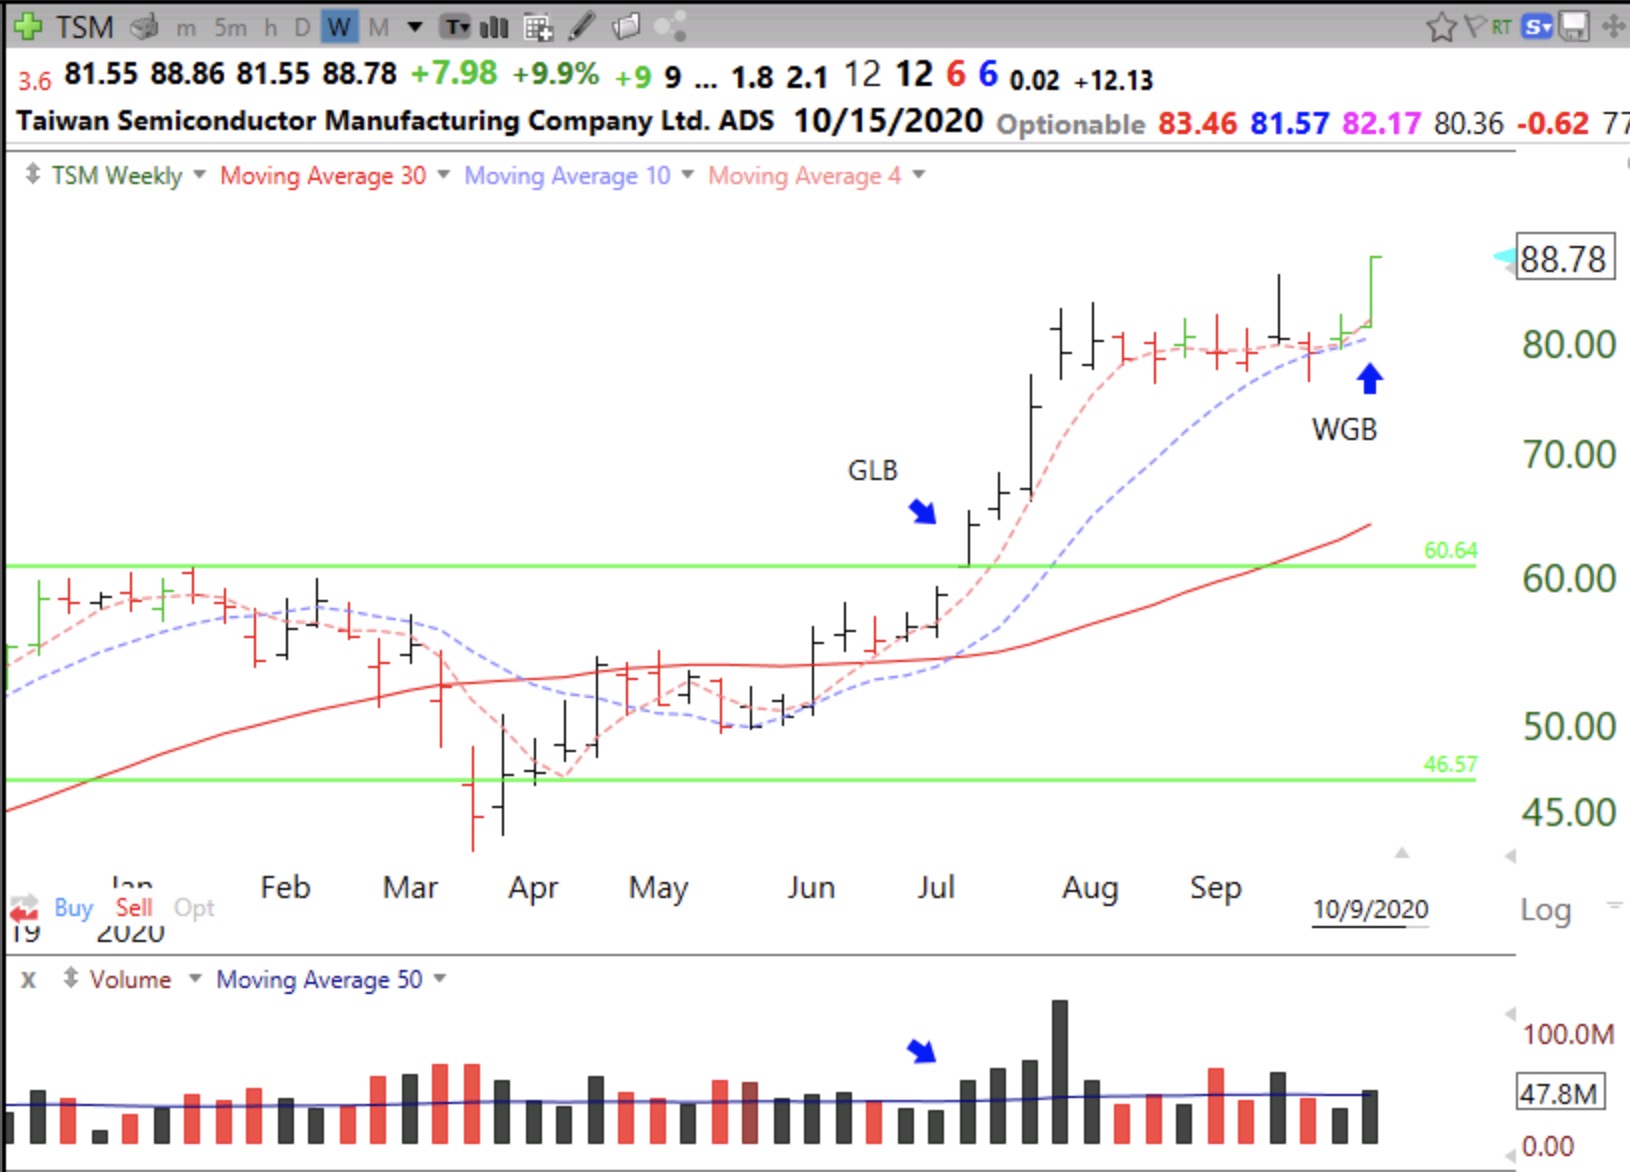
One of my former students texted me about TSM. This weekly chart shows that TSM had a green line break-out (GLB) to an all-time-high in early July at 60.64 and advanced for 5 weeks to $84(+31%). It then consolidated for 9 weeks until the break-out last week. Last week was a WGB (weekly green bar) signal. This means that the 3 weekly averages of price were lined up properly with 4wk>10wk>30wk and the stock bounced up off of its rising 4 week average (red dotted line). I like to buy such stocks and then wait to see if the stock holds its 4 week average. If it does, I hold and monitor the weekly chart for a close below the 4 wk and/or 10 week averages to exit. (If I watch the daily chart I often get shaken out of a good stock.) I might sell half of my position with a weekly close below the 4 wk average. Successful growth stocks can hold this pattern for months. I can add to my position on subsequent WGBs. I described a similar weekly pattern and my yellow band pattern during my 2012 Worden TC2000 workshop available for free at the webinars tab above on my blog or by clicking here.
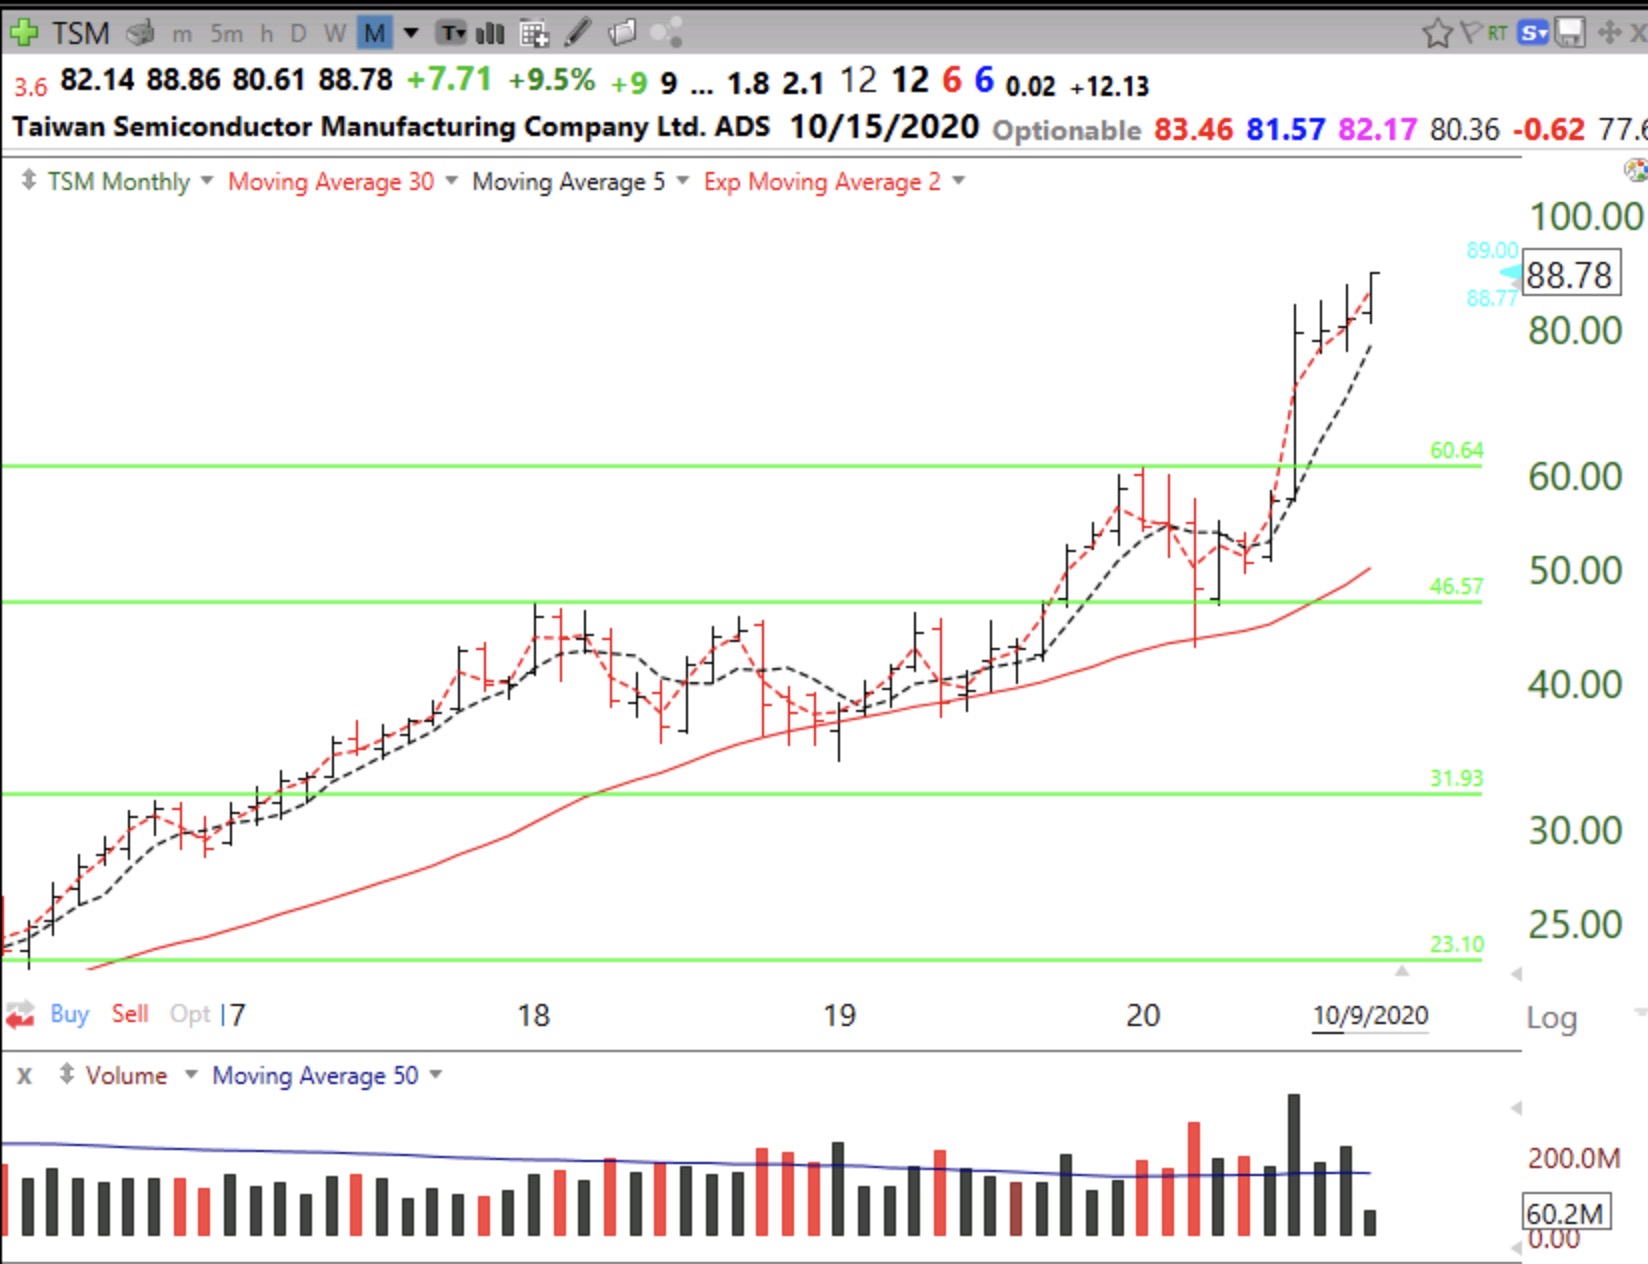
I always look at a stock’s monthly chart before buying. TSM’s monthly chart clearly shows the large volume GLB followed by a sideways consolidation.
I next checked TSM’s fundamentals and technicals on investors.com and MarketSmith. Taiwan Semiconductor’s Industry group’s rank=68/197, not too great. However, its IBD composite rating=97, EPS change last quarter=+93%, sales last quarter+36%, annual ROE=20.9%, price RS=92 and it has 7 quarters of increasing fund ownership. Earnings for 2020 are estimated to be +47%. TSM would be worthy of my consideration for purchase, but earnings are due to be released this week, on 10/15. I don’t hold over earnings unless I have a nice cushion on the stock. So I would not buy TSM this week even though the recent GLB suggests to me that earnings will be good. I hope my students will use this post to guide them as they learn about selecting stocks to trade in their virtual trading competition.
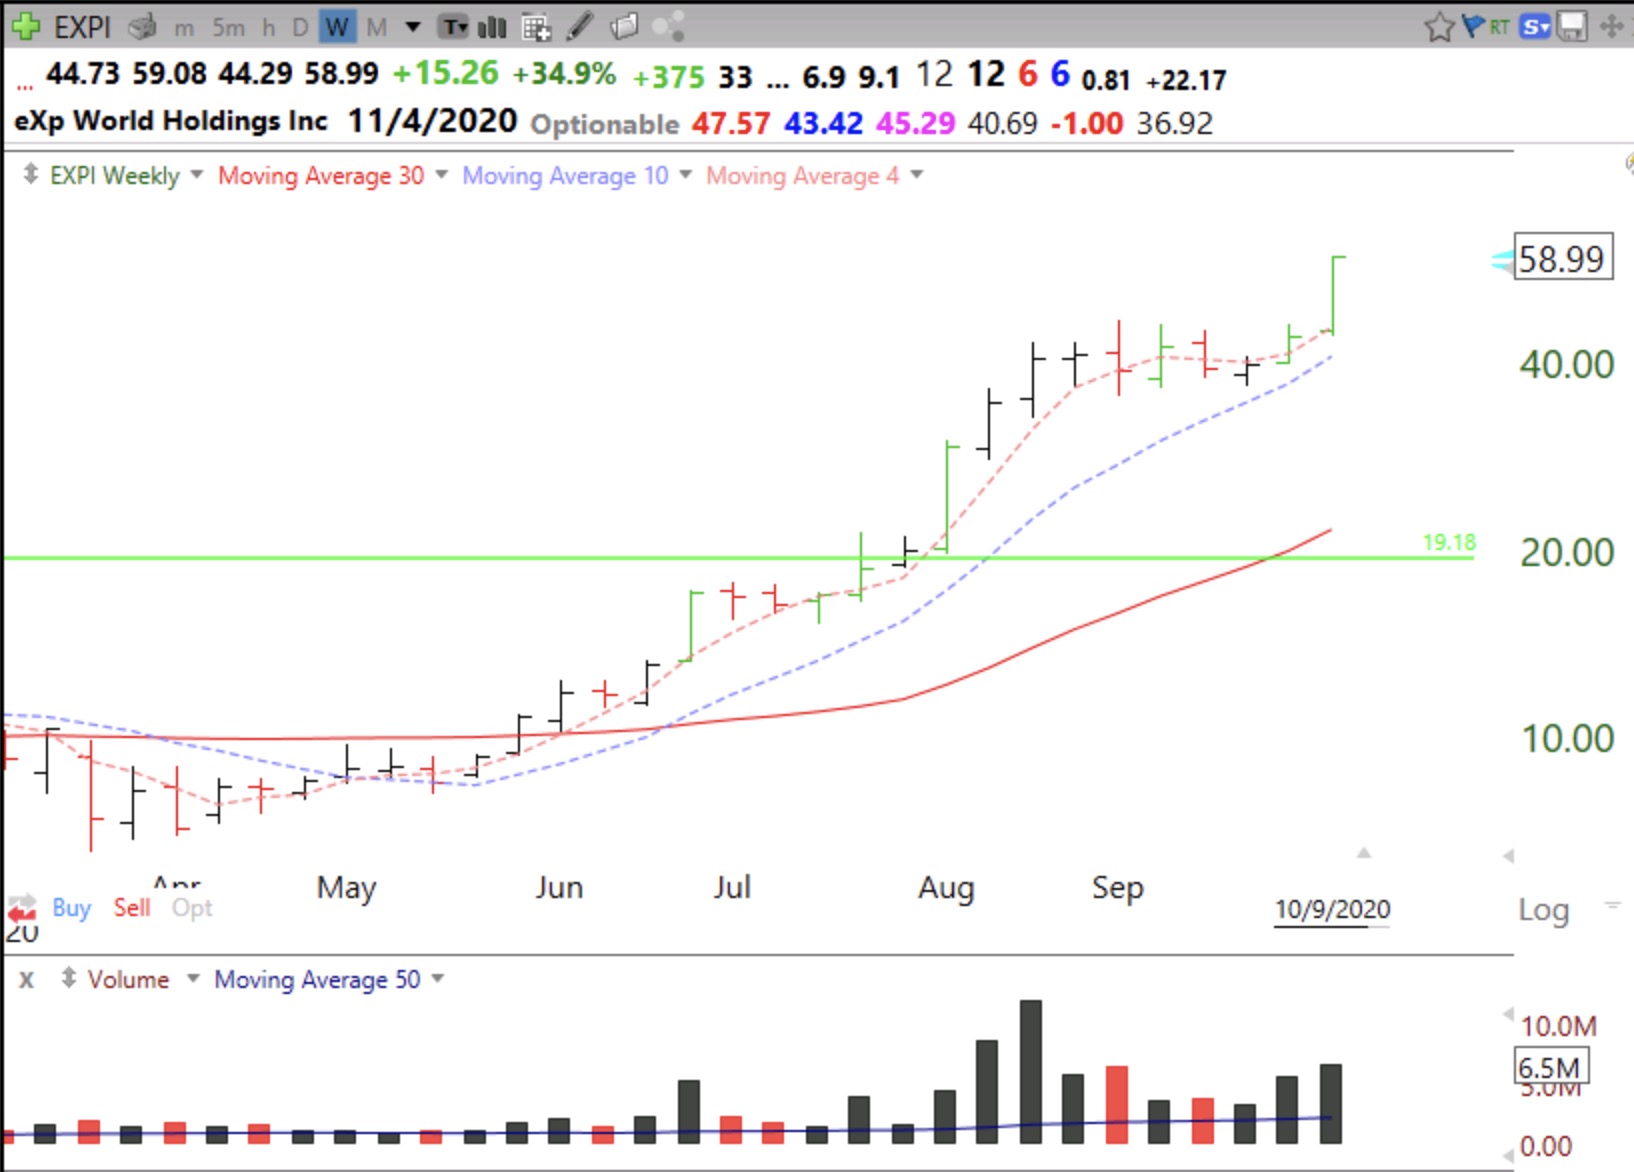
EXPI is another promising growth stock with a WGB last week. Note the similarity of this weekly chart to that of TSM above.
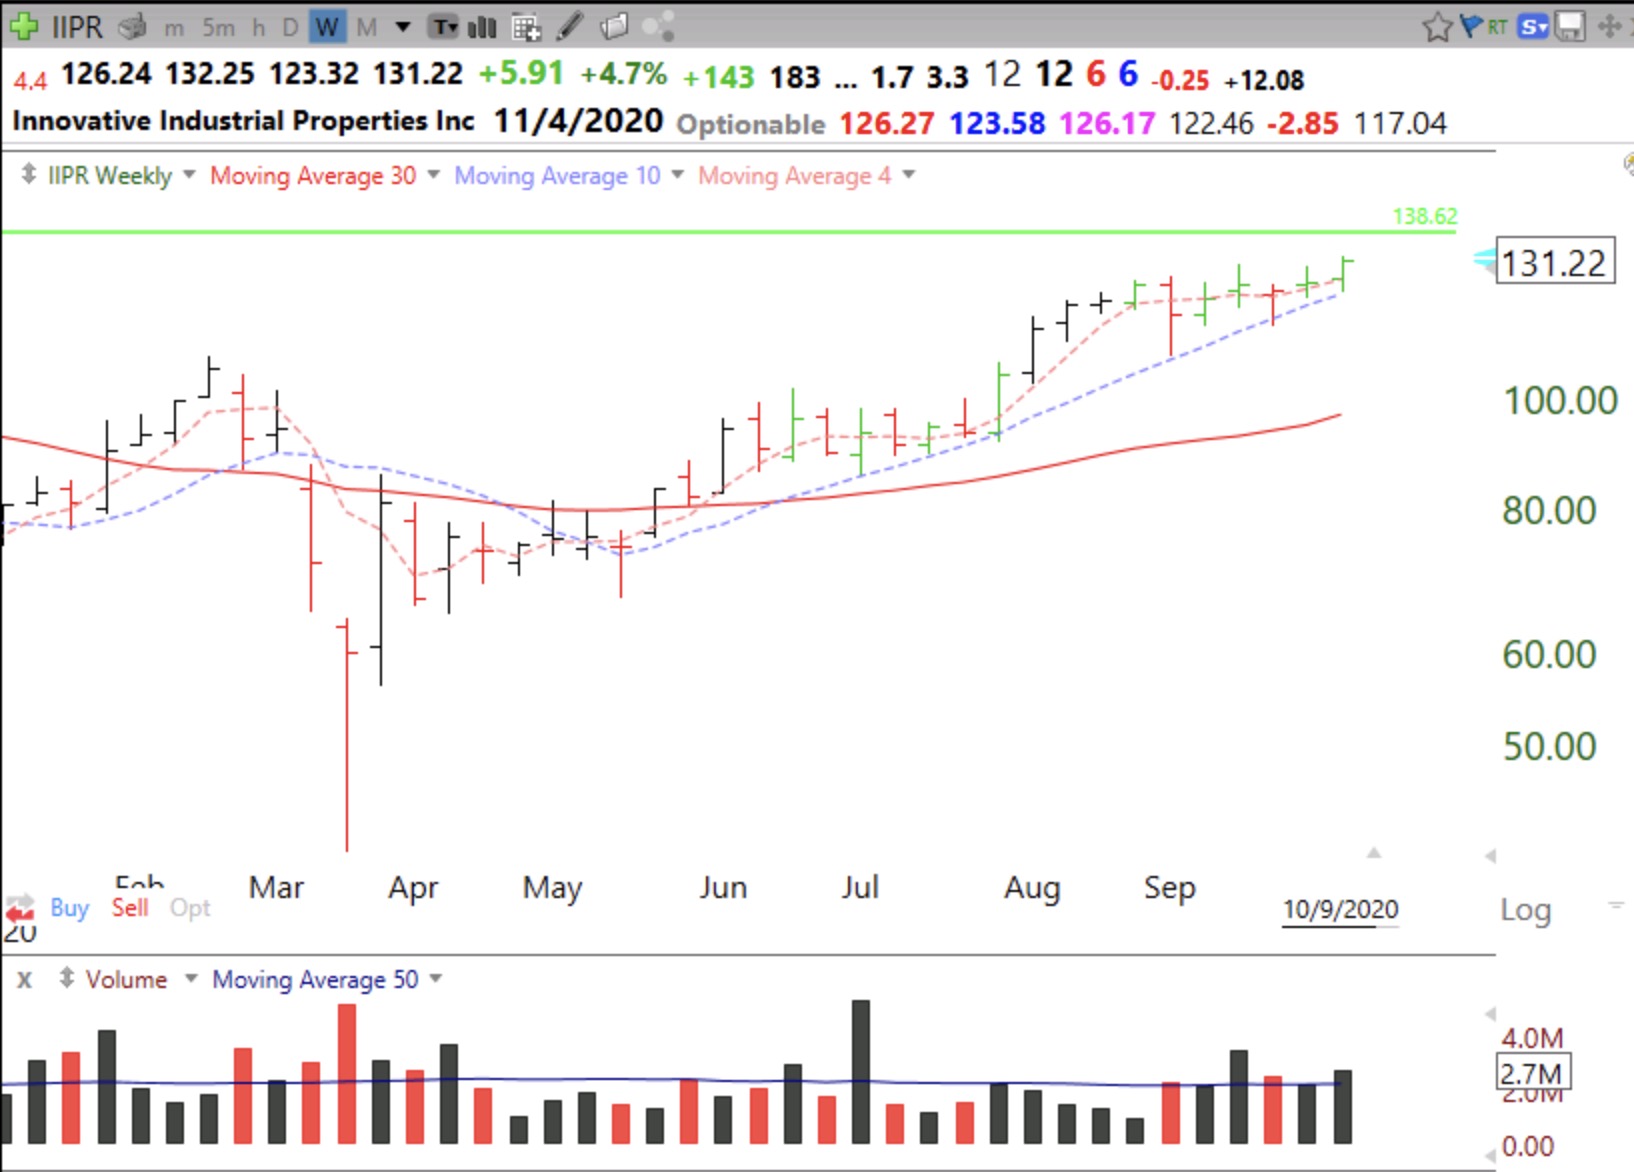
With 5 states voting on marijuana this November, It is also worth monitoring the marijuana-related stock, IIPR, which is heading toward a GLB and had a WGB last week. Note the large black volume bars. Let’s see how high IIPR can get, hah ha.
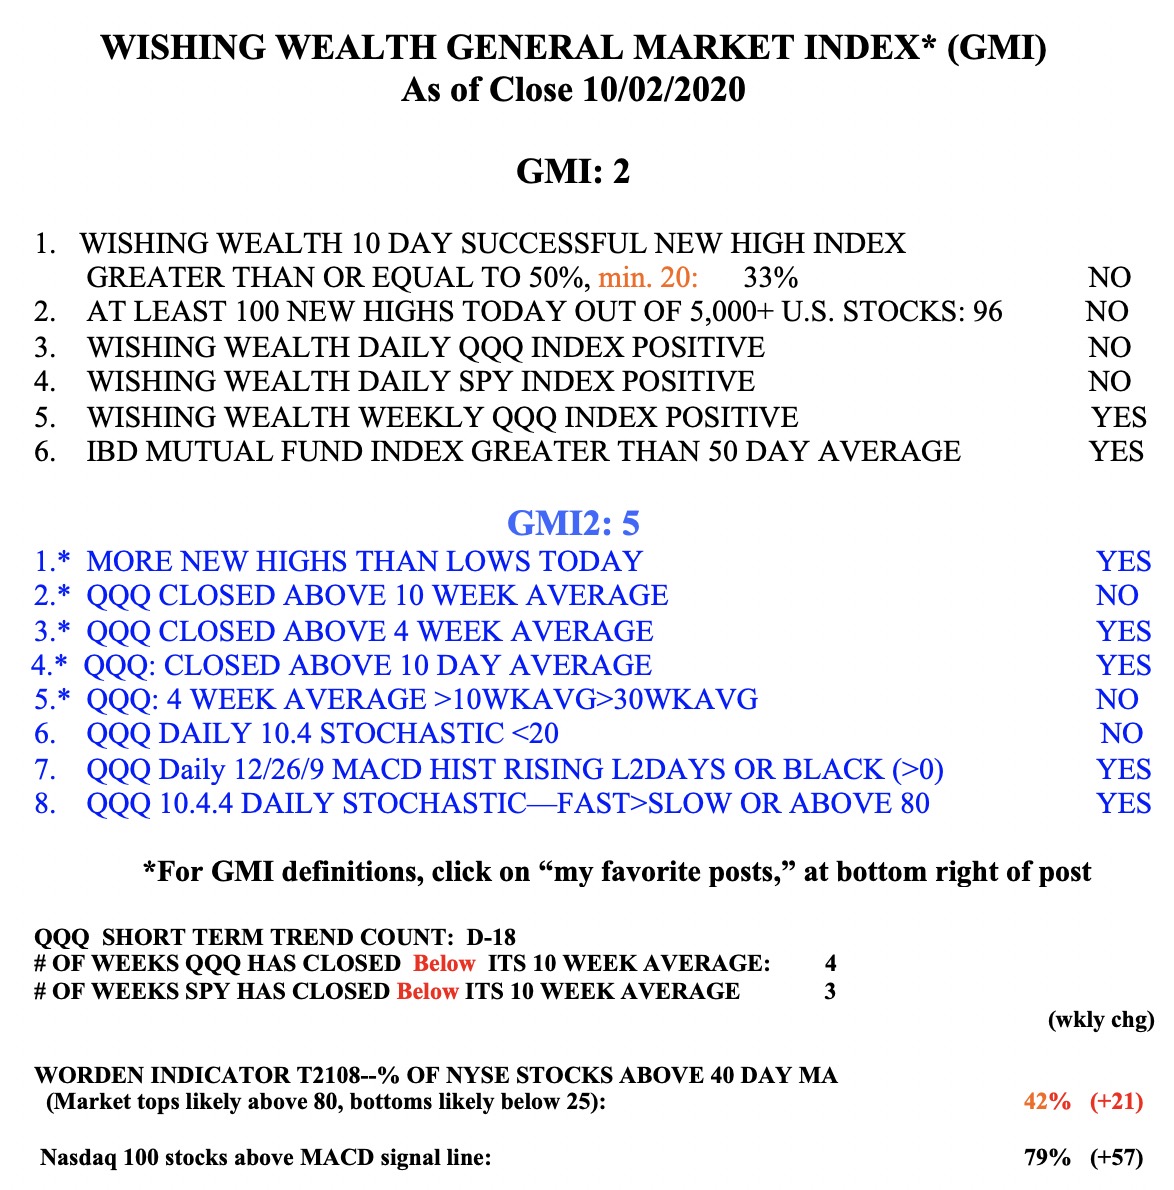
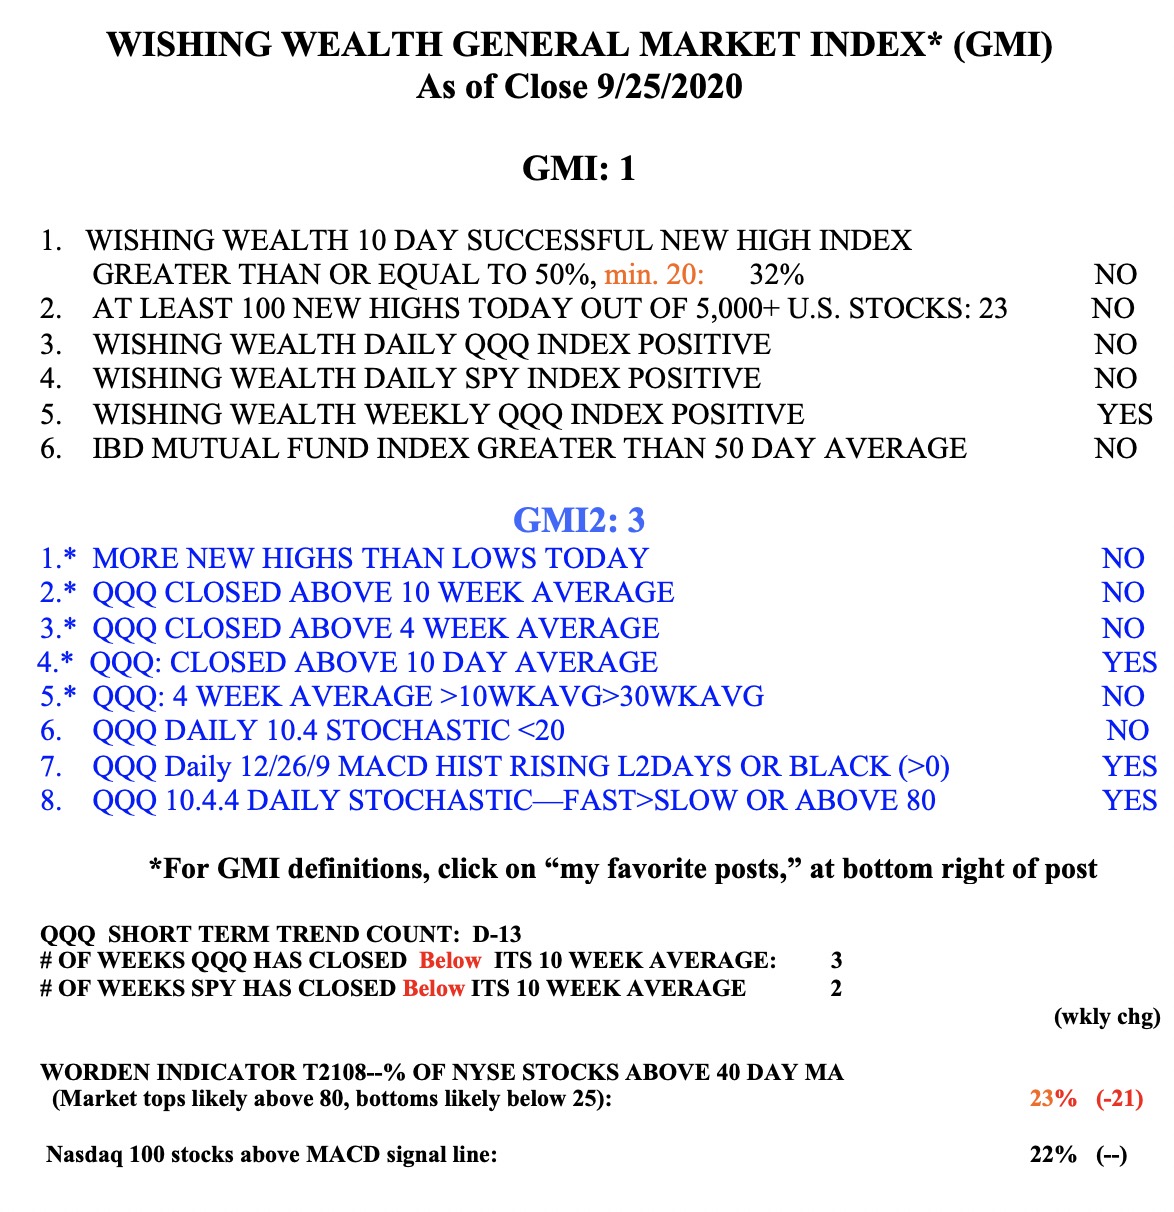
The GMI is at 6 (of 6) and remains on a Green signal.